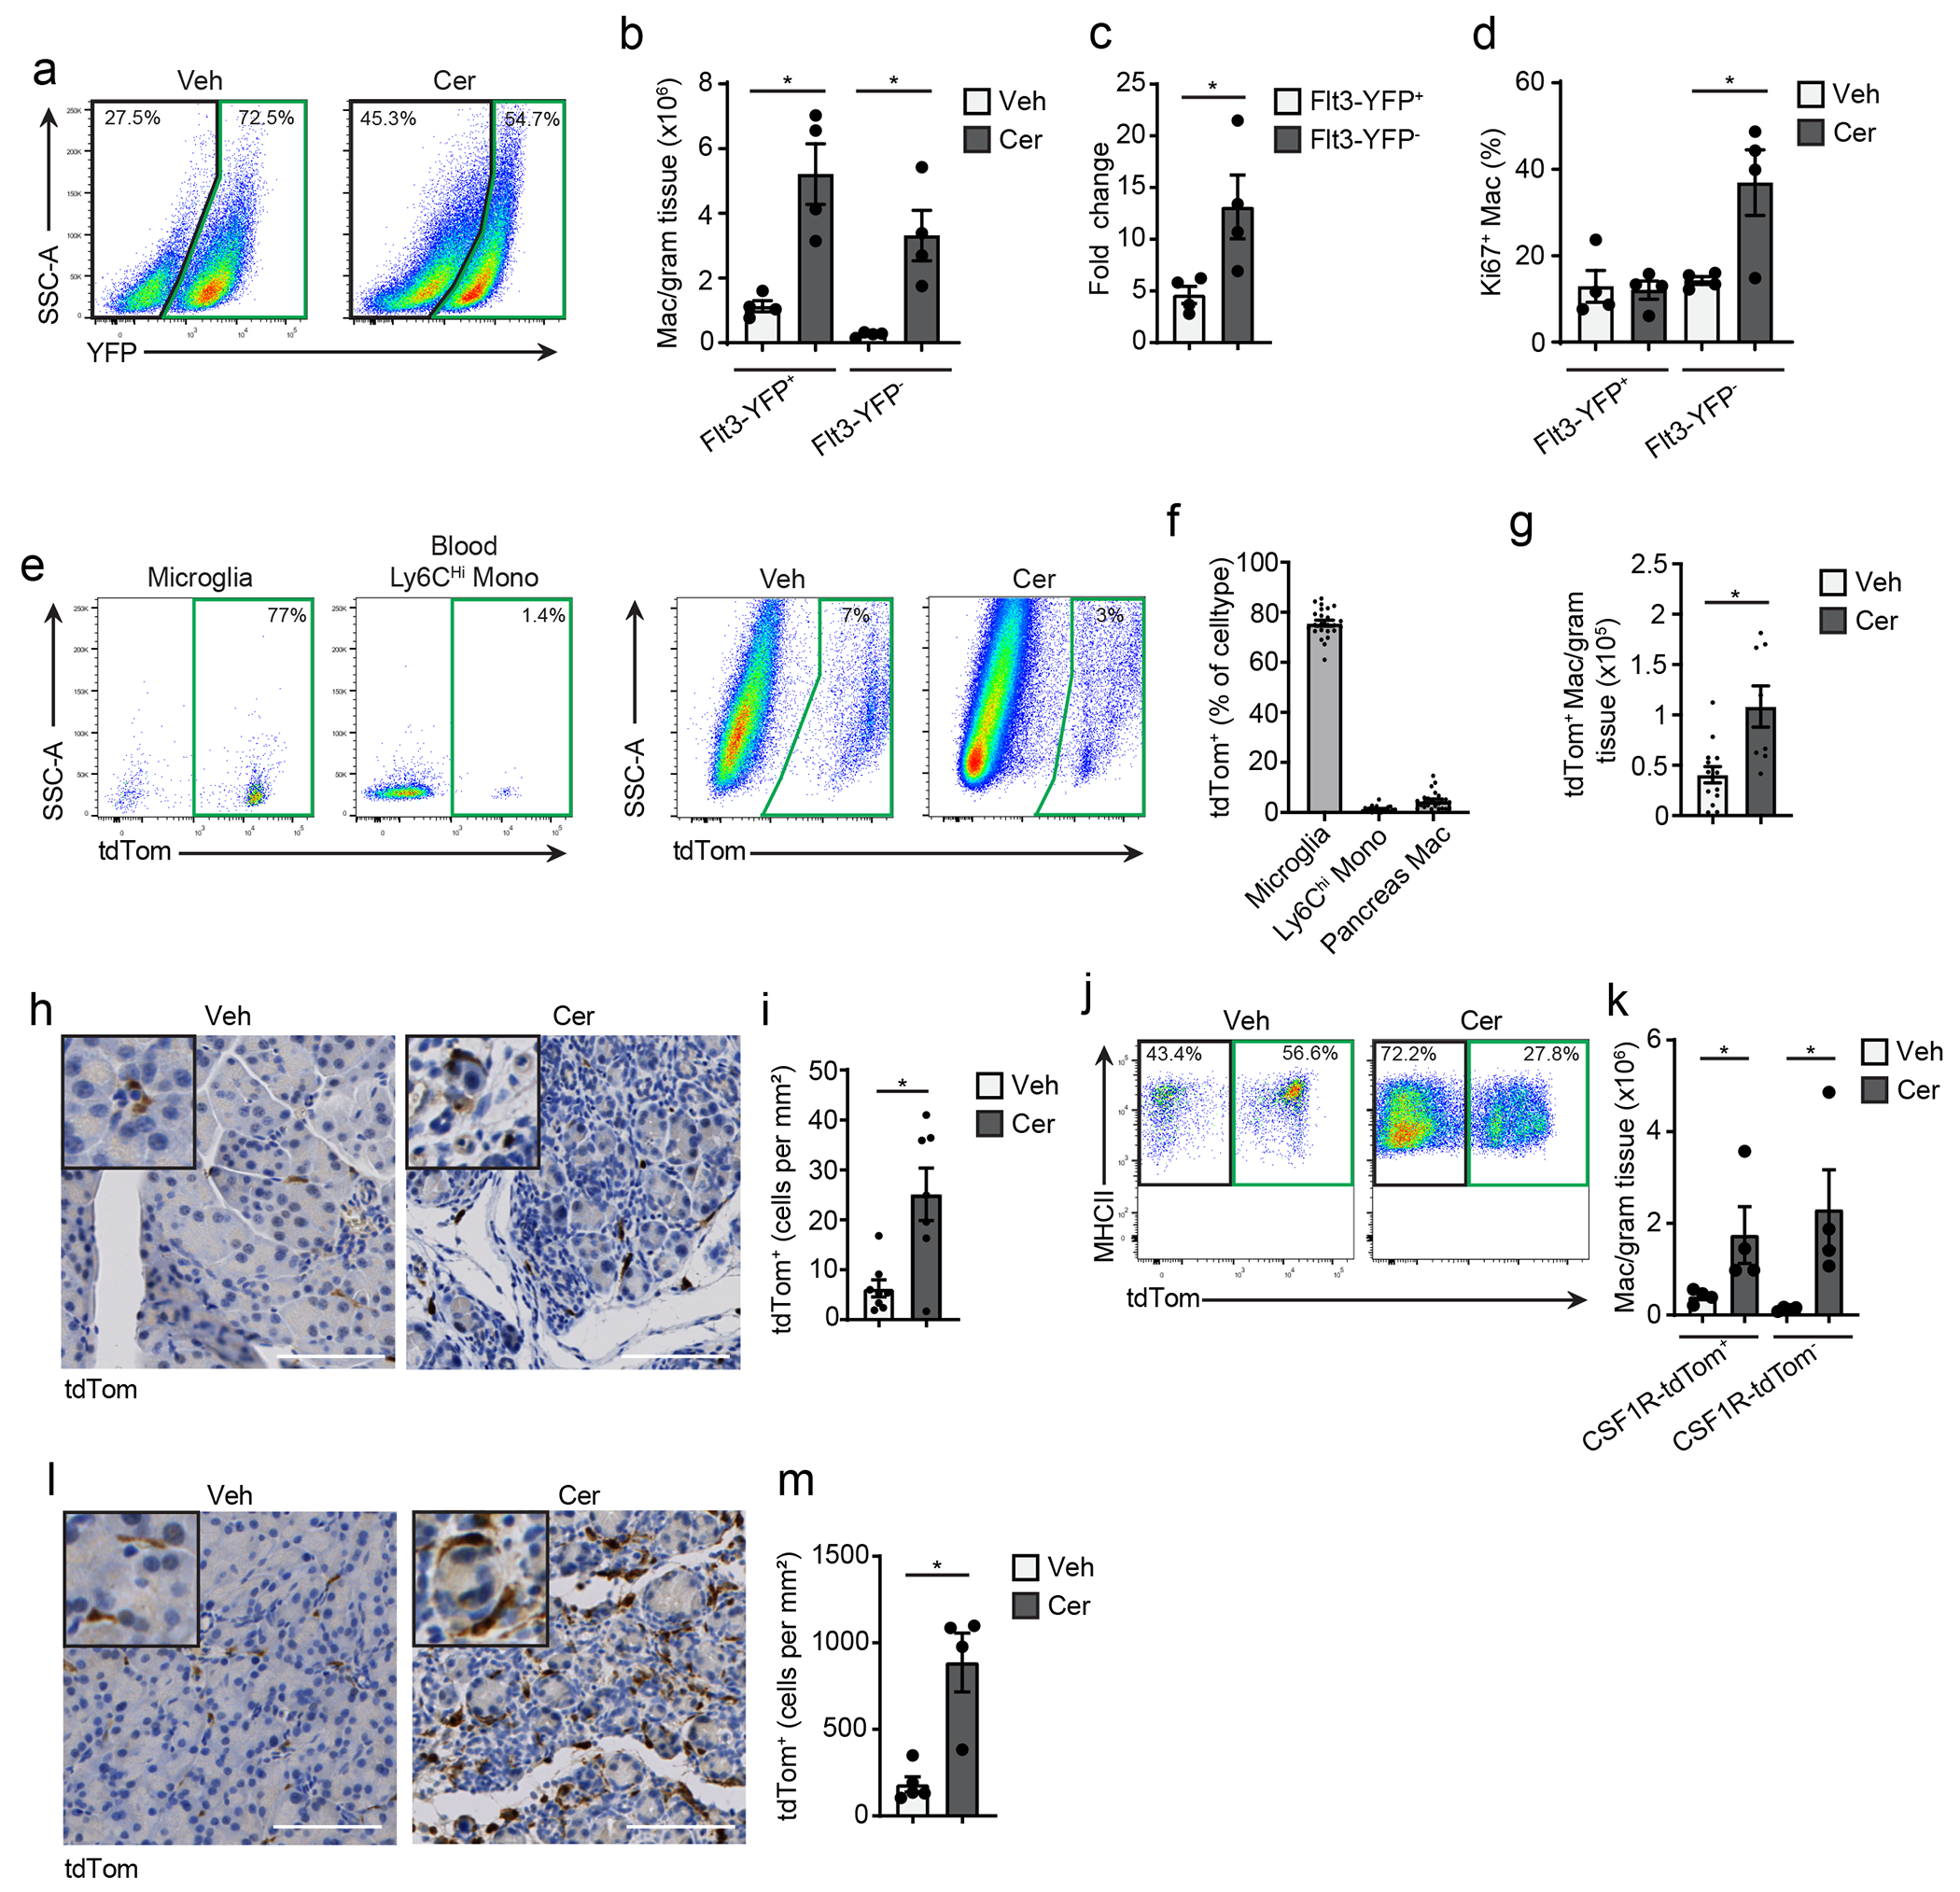
Figure 2: Cerulein treatment increases tissue-resident macrophages.

a. Flow cytometry staining of Flt3-YFP+ and Flt3-YFP− cells pre-gated on pancreas F4/80+MHCIIhi/lo macrophages in Flt3-Cre LSL-YFP (Flt3-YFP) mice. b. Density of Flt3-YFP+ and Flt3-YFP− macrophages in the pancreas of Flt3-YFP mice after 6 hourly i.p. injections with Veh or Cer every other day for one week; n = 4 mice/group, left to right *P=0.0052 and *P=0.0077. c. Fold-change in the density of Flt3-YFP+ and Flt3-YFP− macrophages in Veh or Cer-treated Flt3-YFP mice as in b; n = 4 mice/group, *P=0.0286. d. Percentage of Flt3-YFP+ and Flt3-YFP− macrophages that expressed Ki-67 in Veh or Cer-treated Flt3-YFP mice as in b; n = 4 mice/group, *P=0.0251. e. Flow cytometry of brain CD45+F4/80lo microglia, blood Ly6Chi monocytes and pancreas F4/80+MHCIIhi/lo macrophages in CSF1R-mer-iCre-mer LSL-tdTomato (CSF1R-tdTom) mice treated in utero with tamoxifen on embryonic day 9.5 (9 days post vaginal plug appearance) followed by treatment with Veh or Cer starting at 8-weeks age as in b. f. Percentage of brain CD45+F4/80lo microglia, blood Ly6Chi monocytes and pancreas F4/80+MHCIIhi/lo macrophages labeled by tdTomato in CSF1R-tdTom mice treated with tamoxifen followed by Veh or Cer as in e; n=24 mice/cell type analyzed. g. Density of pancreas F4/80+MHCIIhi/lo macrophages labeled by tdTomato in CSF1R-tdTom mice treated with tamoxifen followed by Veh or Cer as in e; Veh, n=14 mice; Cer, n=8 mice, *P=0.0022 . h. Representative images of IHC stain for tdTomato in pancreas tissue from CSF1R-tdTom mice treated with tamoxifen followed by Veh or Cer as in e i. Quantification of tdTomato+ cells in pancreas tissue of CSF1R-tdTom mice treated with tamoxifen followed by Veh or Cer as in e; Veh, n=8 mice; Cer, n=7 mice, *P=0.0289. j. Flow cytometry of tdTomato expression in pancreas F4/80+MHCIIhi/lo macrophages in CSF1R-tdTom mice administered tamoxifen by oral gavage for five consecutive days, followed by 10 weeks rest and then treated with Veh or Cer as in b; n = 4 mice/group. k. Density of pancreas tdTomato+ and tdTomato−macrophages in CSF1R-tdTom mice as in j; n = 4 mice/group, left to right *P=0.0286 and *P=0.0286. l. Representative images of IHC stain for tdTomato on pancreas from CSF1R-tdTom as in j; n = 4 mice/group. m. Quantification of pancreas tdTomato+ macrophages from CSF1R-tdTom mice as in j; n = 4 mice/group, *P=0.0159. Data are presented as mean ± SEM. n.s., not significant; *p <0.05. For comparisons between two groups, Student’s two-tailed t-test was used.
