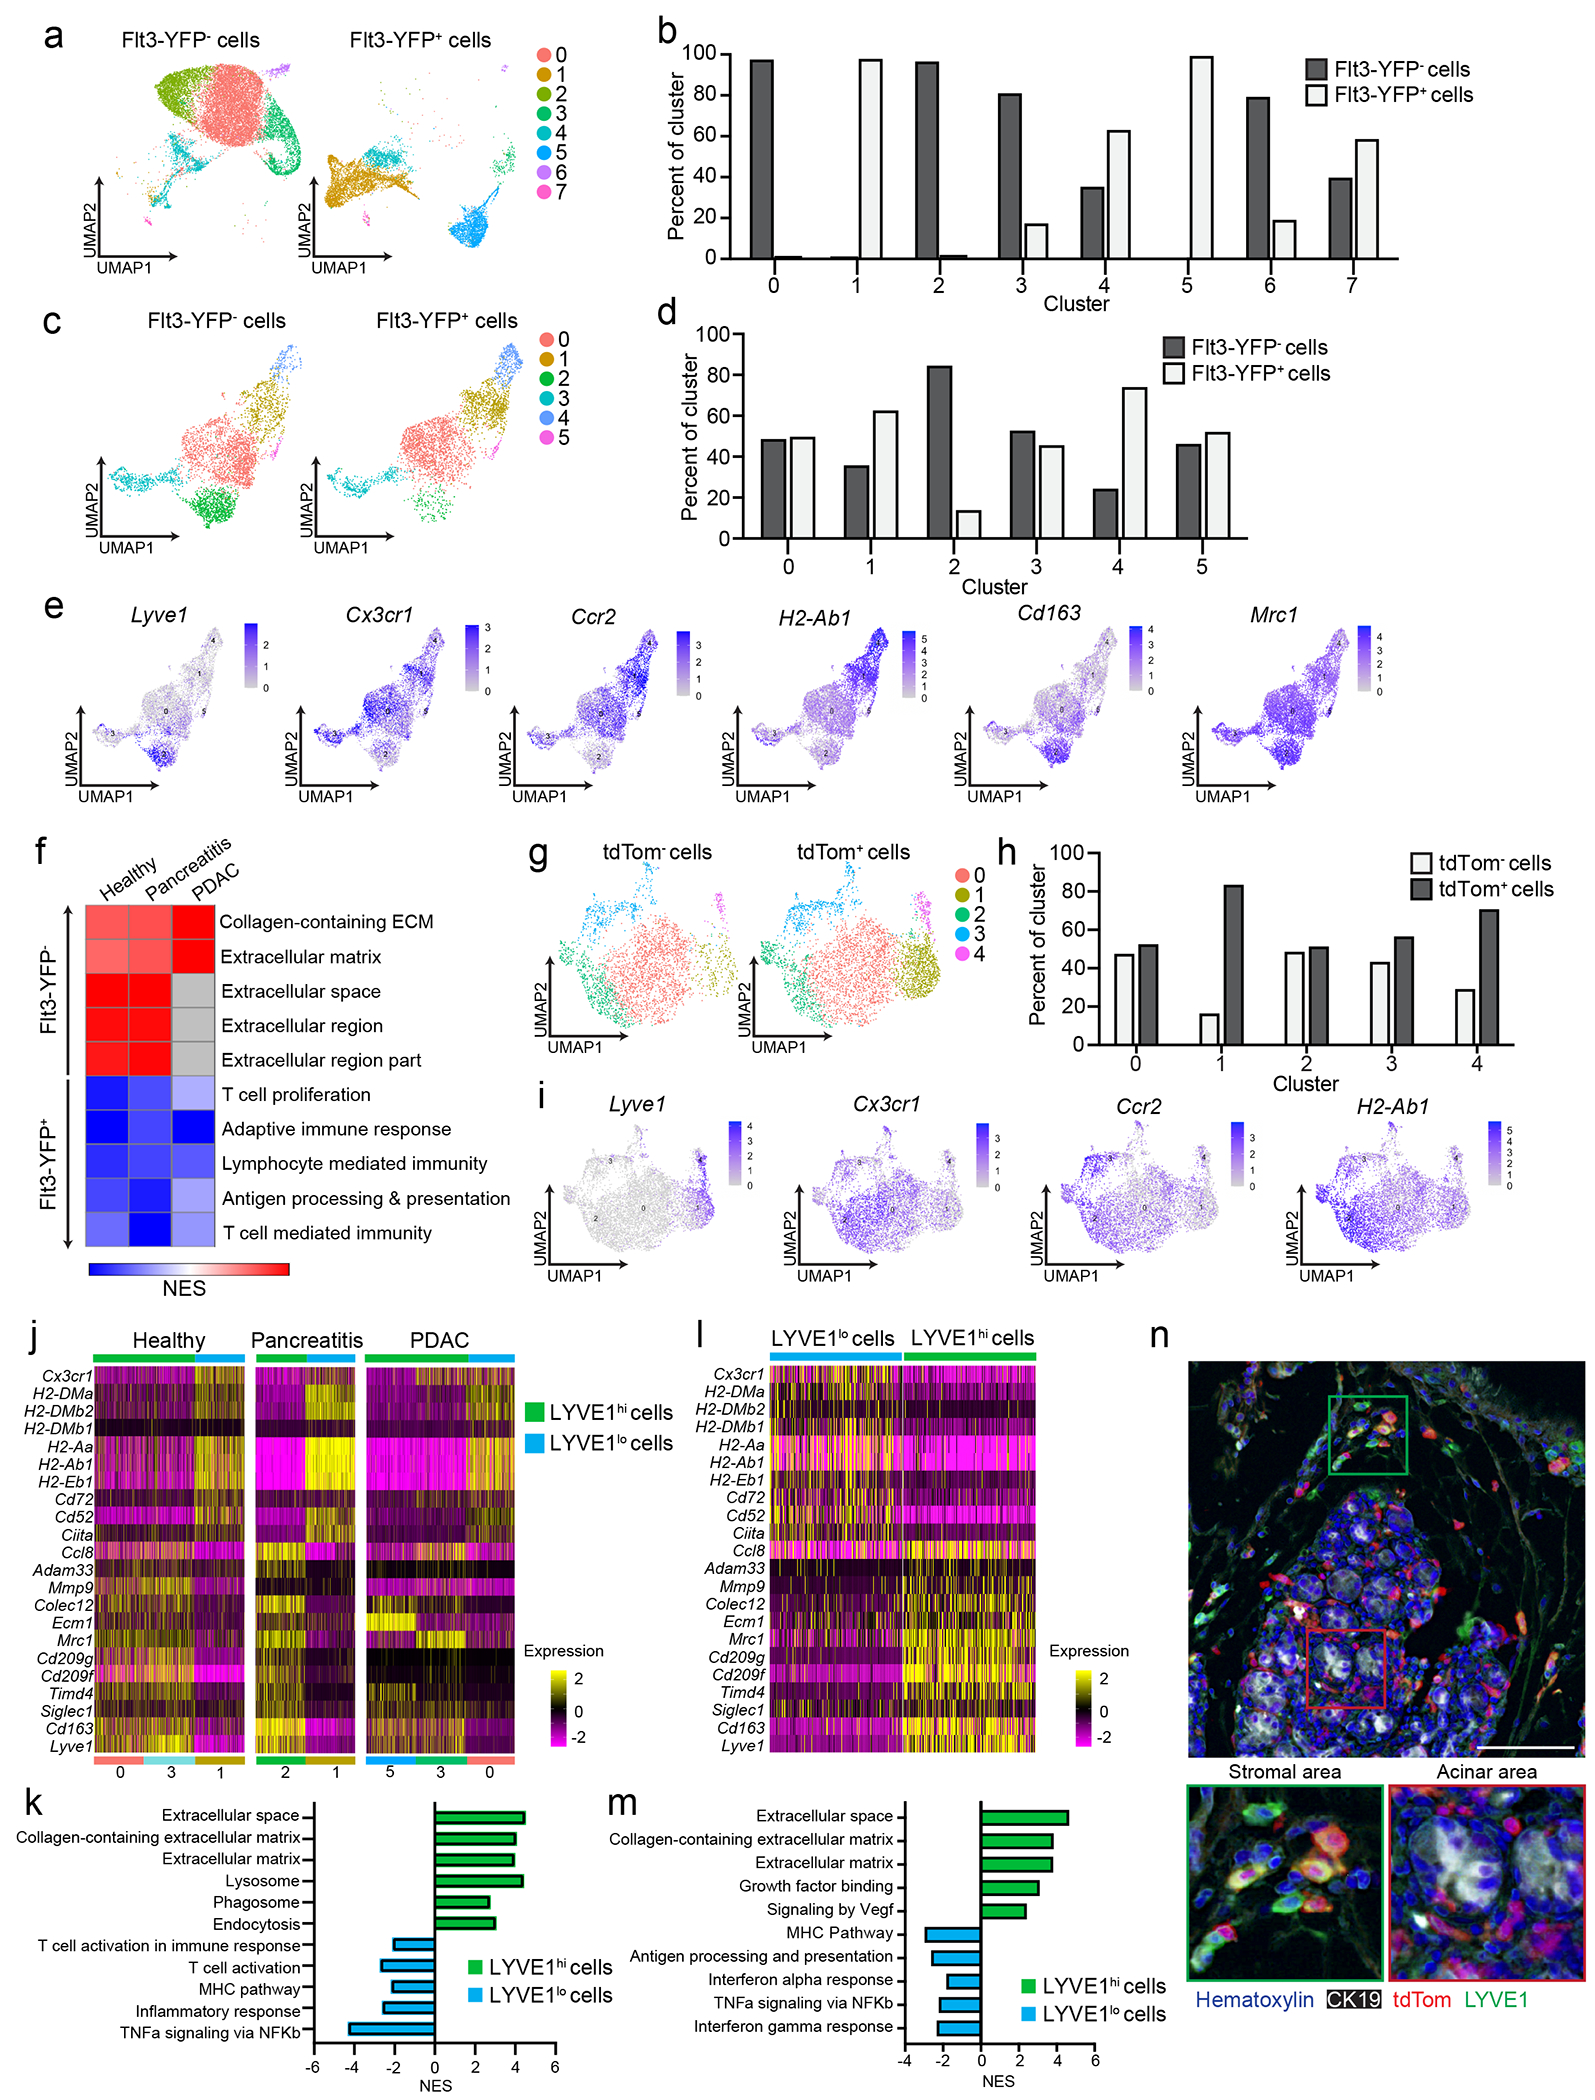
Figure 3: Pancreas TRMs have distinct transcriptional phenotypes.

a. UMAP plot from single-cell RNA-sequencing (scRNA-seq) analysis of F4/80+MHCIIhi/lo macrophages sorted from livers of Flt3-YFP mice on day 14 post-implantation with the KP2 pancreatic cancer cell line. b. Quantification of Flt3-YFP+ and Flt3-YFP− macrophages by cluster from UMAP in a, displayed as percentage of each cluster. c. UMAP plot of scRNA-seq analysis of F4/80+MHCIIhi/lo macrophages sorted from the pancreas of Flt3-YFP mice treated with 6 hourly i.p. injections of Cer every other day for one week. d. Quantification of Flt3-YFP+ and Flt3-YFP− macrophages by cluster from UMAP in c, displayed as percentage of each cluster. e. UMAP plots displaying Lyve1, Cx3cr1, Ccr2, H2-Ab1, Cd163 and Mrc1 gene expression in Csf1r and C1qa expressing pancreas macrophages from Flt3-YFP mice as in c f. Heatmap displaying normalized enrichment score (NES) of significantly enriched gene sets comparing all Flt3-YFP− macrophages versus Flt3-YFP+ macrophages in indicated single-cell data sets; pathways selected by FDR < 0.05. g. UMAP plot of scRNA-seq analysis of F4/80+MHCIIhi/lo macrophages sorted from the pancreas of CSF1R-tdTom mice administered tamoxifen by oral gavage for 5 consecutive days, followed by a rest period of 10 weeks and a regimen of 6 hourly Cer i.p. injections every other day for one week. h. Quantification of tdTom− and tdTom+ macrophages by cluster from UMAP in g, displayed as percentage of each cluster. i. UMAP plots of Lyve1, Cx3cr1, Ccr2 and H2-Ab1 expression in Csf1r and C1qa expressing pancreas macrophages from CSF1R-tdTom mice as in g. j. Heatmap of DEGs upregulated in either LYVE1hi or LYVE1lo macrophages across healthy pancreas, pancreatitis and PDAC samples from Flt3-YFP mice treated with vehicle (Healthy) or cerulein (Pancreatitis) as in c, or orthotopically implanted with the KP1 pancreatic cancer cell line (PDAC). k. Bar graph of NES values of gene sets in LYVE1hi and LYVE1lo macrophages as in j. l. Heatmap of DEGs upregulated in either LYVE1hi or LYVE1lo macrophages from the pancreas of CSF1R-tdTom mice treated as in g. m. Bar graph of NES values of gene sets in LYVE1hi to LYVE1lo macrophages as in l. n. Representative images from multiplex immunohistochemistry (mIHC) staining for hematoxylin, F4/80, tdTomato, LYVE1 and CK19 in the pancreas of cerulein-treated CSF1R-tdTom mice treated as in g, staining repeated for 4 Veh- and 4 Cer-treated mice. Data are presented as mean ± SEM unless otherwise indicated. n.s., not significant; *p <0.05. For comparisons between two groups, Student’s two-tailed t-test was used, except for j and l, where Bonferroni correction was used, and f, k, and m, where FDR was used.
