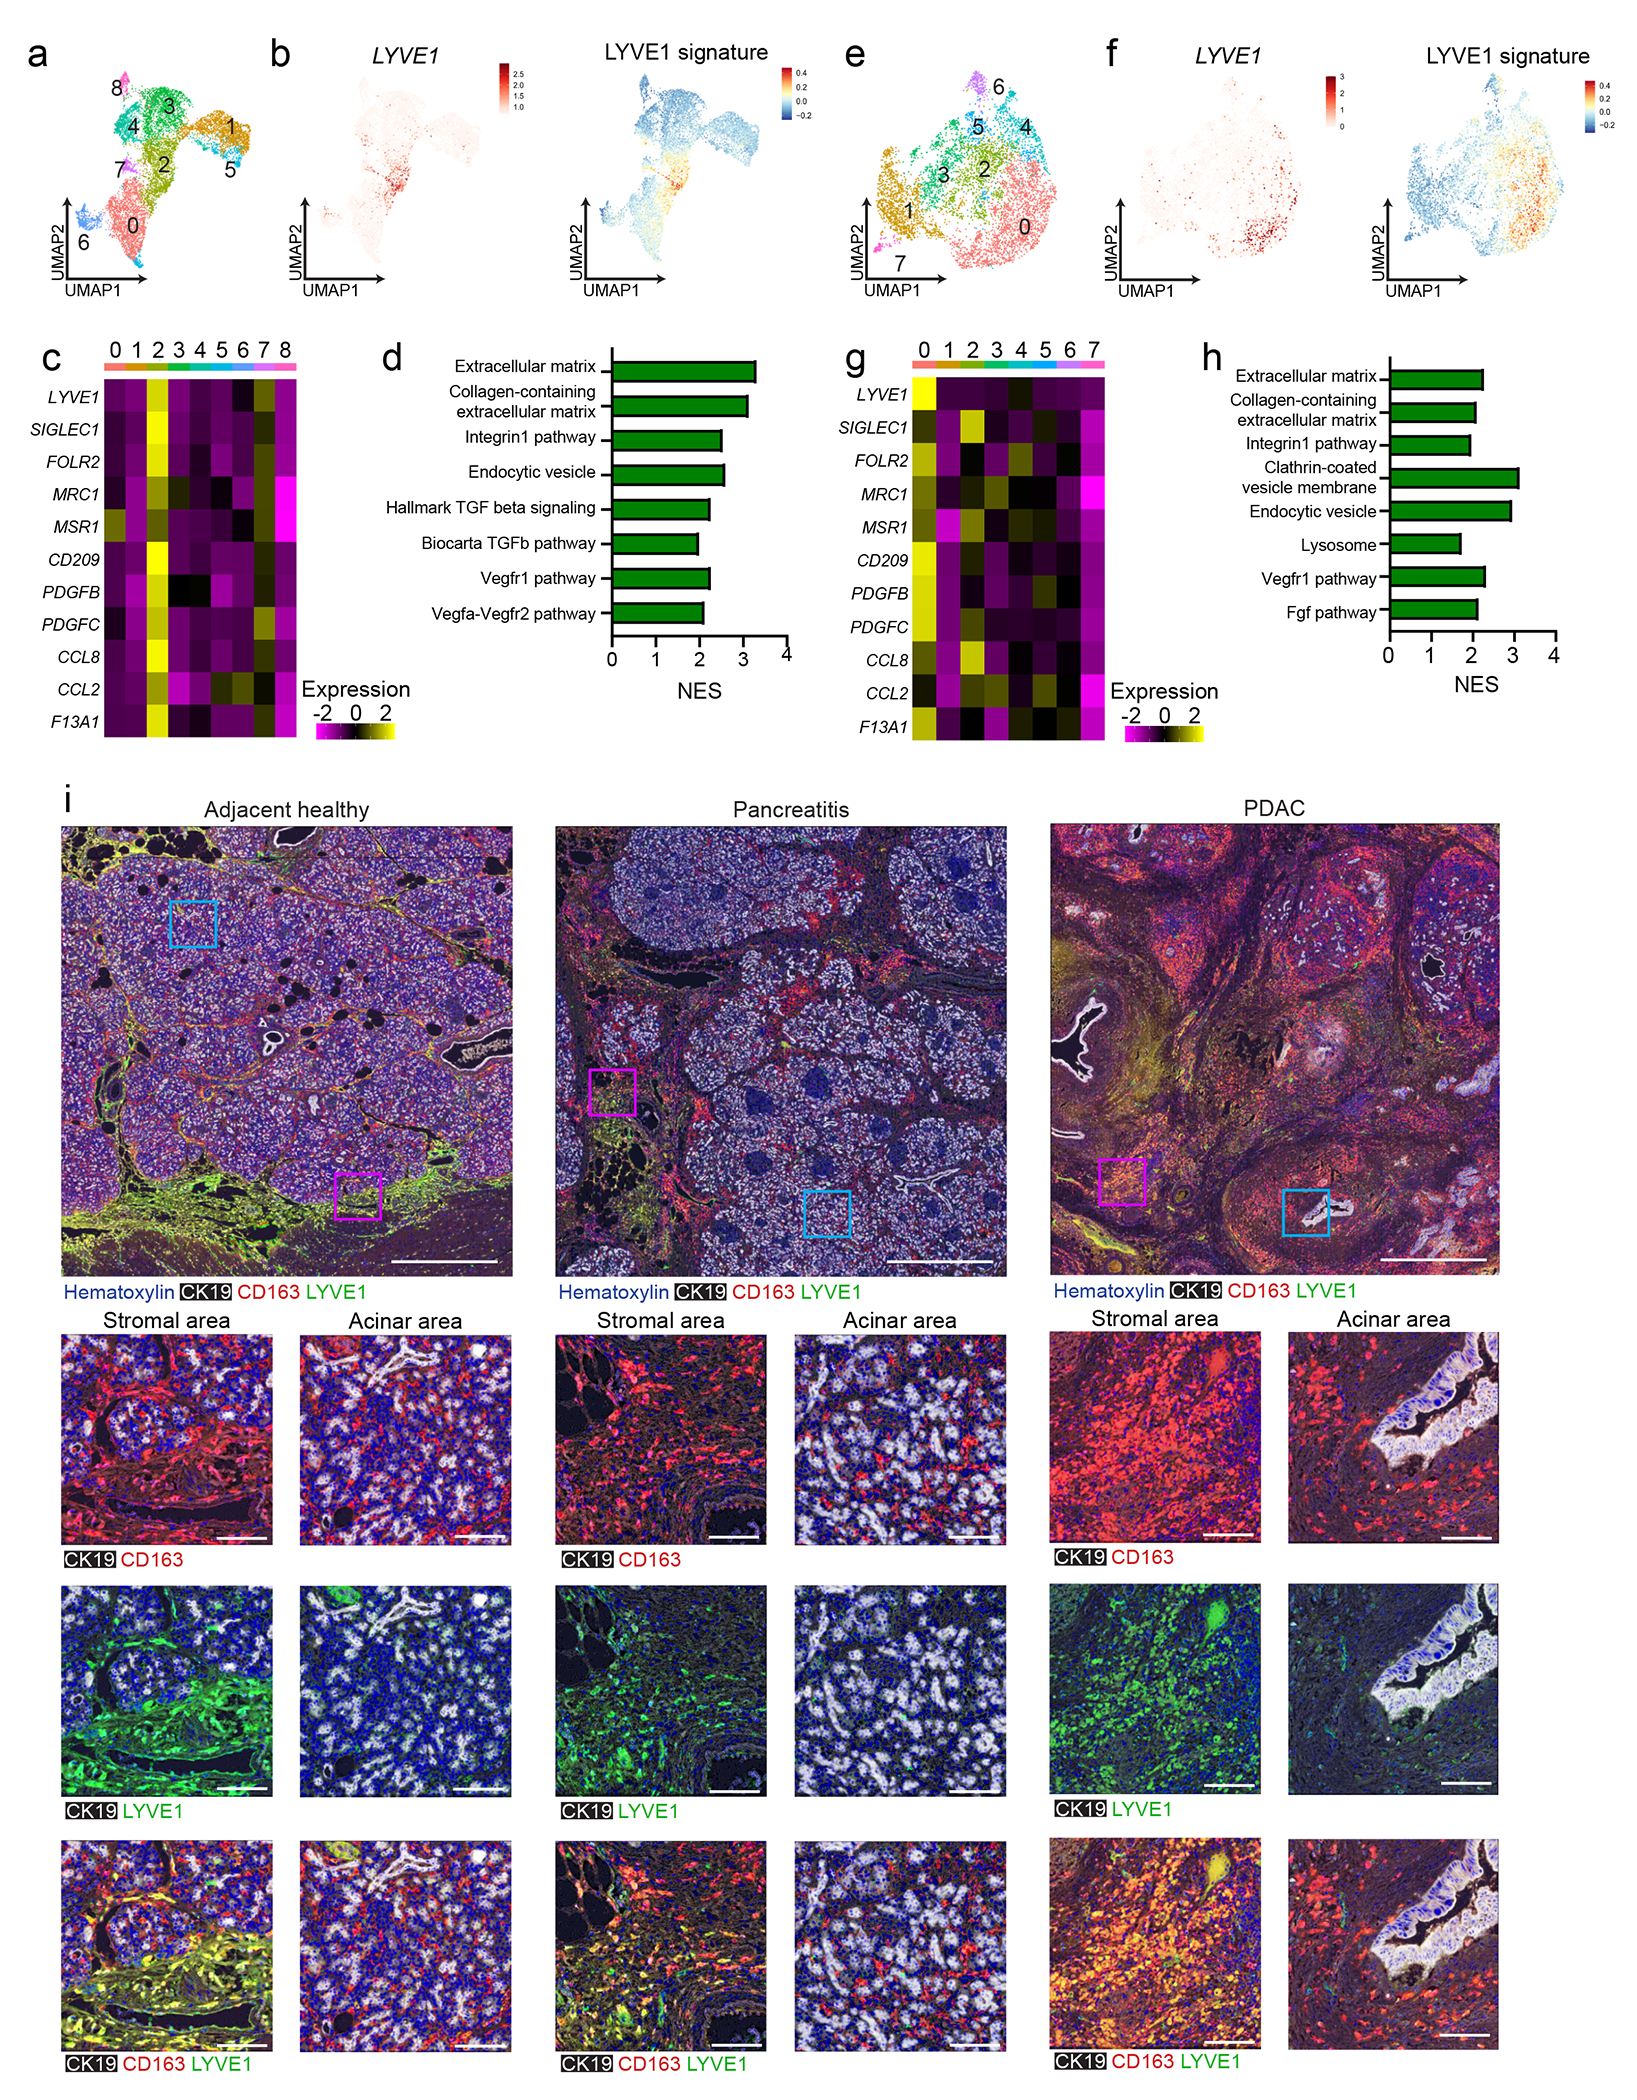
Figure 4: Human LYVE1+ TRMs display similar phenotype and localization.

a. UMAP of scRNA-seq analysis in monocytes/macrophages from published human chronic pancreatitis dataset34, including 3 healthy pancreas, 4 idiopathic and 5 hereditary chronic pancreatitis samples. b. UMAP plots showing LYVE1 gene expression and mouse LYVE1hi macrophage scRNA-seq signature using top 100 DEGs from mouse LYVE1hi macrophages mapped into healthy and chronic pancreatitis samples from a. c. Heatmap of select marker genes differentially expressed in human chronic pancreatitis cluster 2. Data are p < 0.05 significant using Bonferroni correction. d. Bar graph of NES values of gene sets enriched in LYVE1hi macrophages from human chronic pancreatitis (cluster 2) compared to all other clusters. Data are FDR < 0.05 significant. e. UMAP of scRNA-seq analysis in monocytes/macrophages from 16 human PDAC samples from published PDAC dataset33. f. UMAP plots of LYVE1 gene expression and mouse LYVE1hi macrophage scRNA-seq signature using top 100 DEGs from mouse LYVE1hi macrophages mapped into PDAC samples from f. g. Heatmap of select marker genes differentially expressed in the human PDAC cluster 0. Data are p < 0.05 significant using Bonferroni correction. h. Bar graph of NES values of gene sets enriched in human PDAC LYVE1hi macrophages (cluster 0) compared to all other clusters. Data are FDR < 0.05 significant. i. Representative multiplex IHC images from adjacent healthy pancreas or pancreatitis and PDAC tumor samples obtained from patients at Barnes-Jewish Hospital stained for hematoxylin, CK19, CD163 and LYVE1. Highlighted areas of stromal or acinar area showing CK19 and CD163, CK19 and Lyve1, or CK19, CD163 and LYVE1 merged. Scale bars are 1mm (top row) or 100μM (bottom 3 rows).
