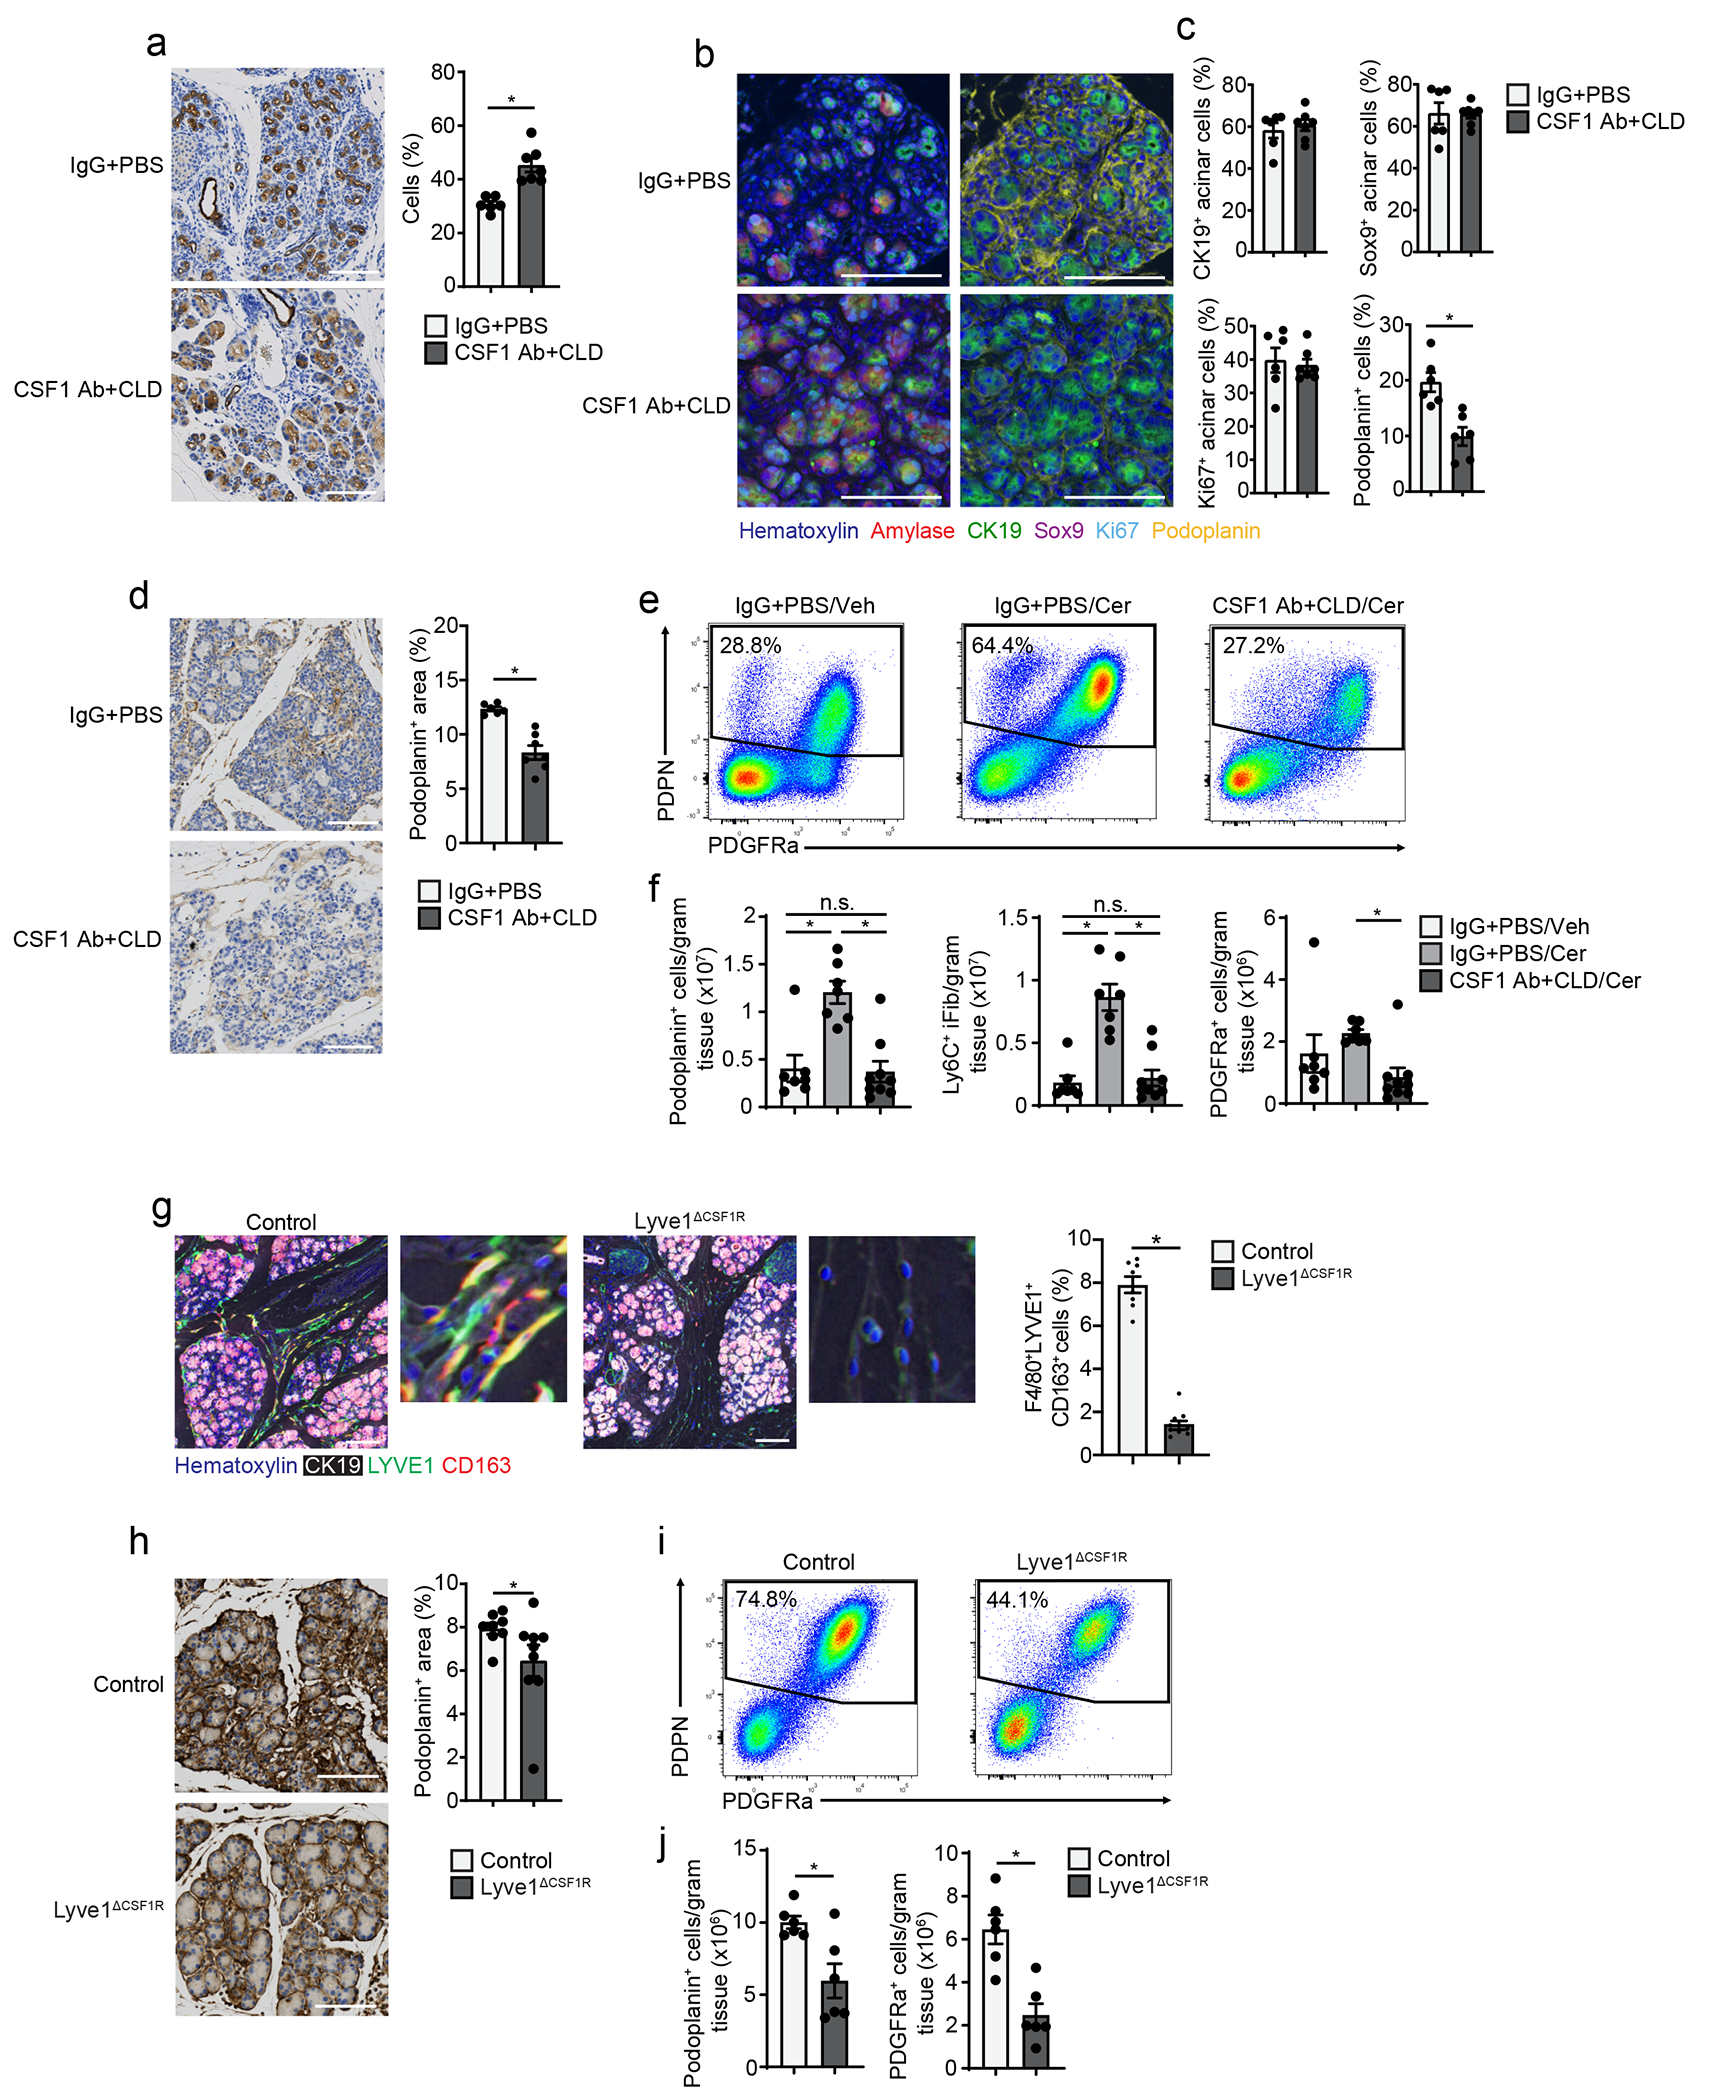
Figure 6: Depletion of TRMs attenuates fibrotic responses.

a. Representative images and quantification of CK19 IHC stain on pancreas tissue of mice treated with IgG+PBS or CSF1 Ab+CLD, followed by a 10-day recovery period, then 6 hourly i.p. injections with Cer every other day for one week; IgG+PBS, n=6 mice; CSF1 Ab+CLD, n=7 mice and *P=0.0012. b. Representative mIHC images of pancreas tissue from mice treated as in a, stained for hematoxylin, amylase, CK19, Sox9, Ki-67, and podoplanin, scale bars are 100μM. c. Quantification of amylase+ acinar cells expressing CK19, Sox9 or Ki-67, displayed as percentage of acinar cells, and podoplanin+ cells, displayed as percentage of total cells; IgG+PBS, n=6 mice; CSF1 Ab+CLD, n=7 mice; and *P=0.0022 for podoplanin analysis. d. Representative images of pancreas tissue stained for podoplanin and quantification of podoplanin+ area in pancreas from mice treated as in a; IgG+PBS , n=6 mice; CSF1 Ab+CLD, n=7 mice and *P=0.0012. e. Flow cytometry plots of IgG+PBS + pancreas fibroblasts from IgG+PBS-treated mice injected i.p with Veh (IgG+PBS/Veh), or IgG+PBS- or CSF1 Ab+CLD-treated mice injected i.p. with Cer (IgG+PBS/Cer or CSF1 Ab+CLD/Cer), as in a. f. Density of pancreas IgG+PBS + fibroblasts, Ly6C+ inflammatory fibroblasts (iFibs) and PDGFRa+ fibroblasts from IgG+PBS/Veh, IgG+PBS/Cer or CSF1 Ab+CLD/Cer mice as in e; IgG+PBS/Veh, n=7 mice; IgG+PBS/Cer, n=7 mice; CSF1 Ab+CLD/Cer, n=9 mice; top to bottom and left to right, *P=0.0005 and *P=0.0003 in podoplanin analysis, *P<0.0001 and *P<0.0001 in Ly6C+ iFib analysis, and *P=0.0409 in PDGFRa analysis. g. Representative mIHC images of pancreas tissue from Lyve1-Cre− mice (Control) or Lyve1-CreCSF1Rflox/flox mice (Lyve1ΔCSF1R) treated with 6 hourly i.p. injections of Cer every other day for one week, stained for hematoxylin, CK19, F4/80, LYVE1 and CD163 and quantification of F4/80+LYVE1+CD163+ pancreas macrophages from Control or Lyve1ΔCSF1R mice treated with Cer, displayed as the percentage of cells; Control, n=8 mice; Lyve1ΔCSF1R, n=9; *P<0.0001. Scale bar, 100μM h. Representative images of podoplanin-stained pancreas tissue and quantification of podoplanin+ area from Control or Lyve1ΔCSF1R mice as in g; Control, n=8 mice; Lyve1ΔCSF1R, n=9, *P<0.0360. i. Flow cytometry plots of podoplanin+ pancreas fibroblasts from Control and Lyve1ΔCSF1R mice as in g. j. Density of pancreas podoplanin+ fibroblasts and PDGFRa+ fibroblasts from Control and Lyve1ΔCSF1R mice as in g; n=6 mice/group, *P=0.0411 in podoplanin analysis and *P=0.0043 in PDGFRa analysis. Data are presented as mean ± SEM unless otherwise indicated. n.s., not significant; *p <0.05. For comparisons between two groups, Student’s two-tailed t-test was used.
