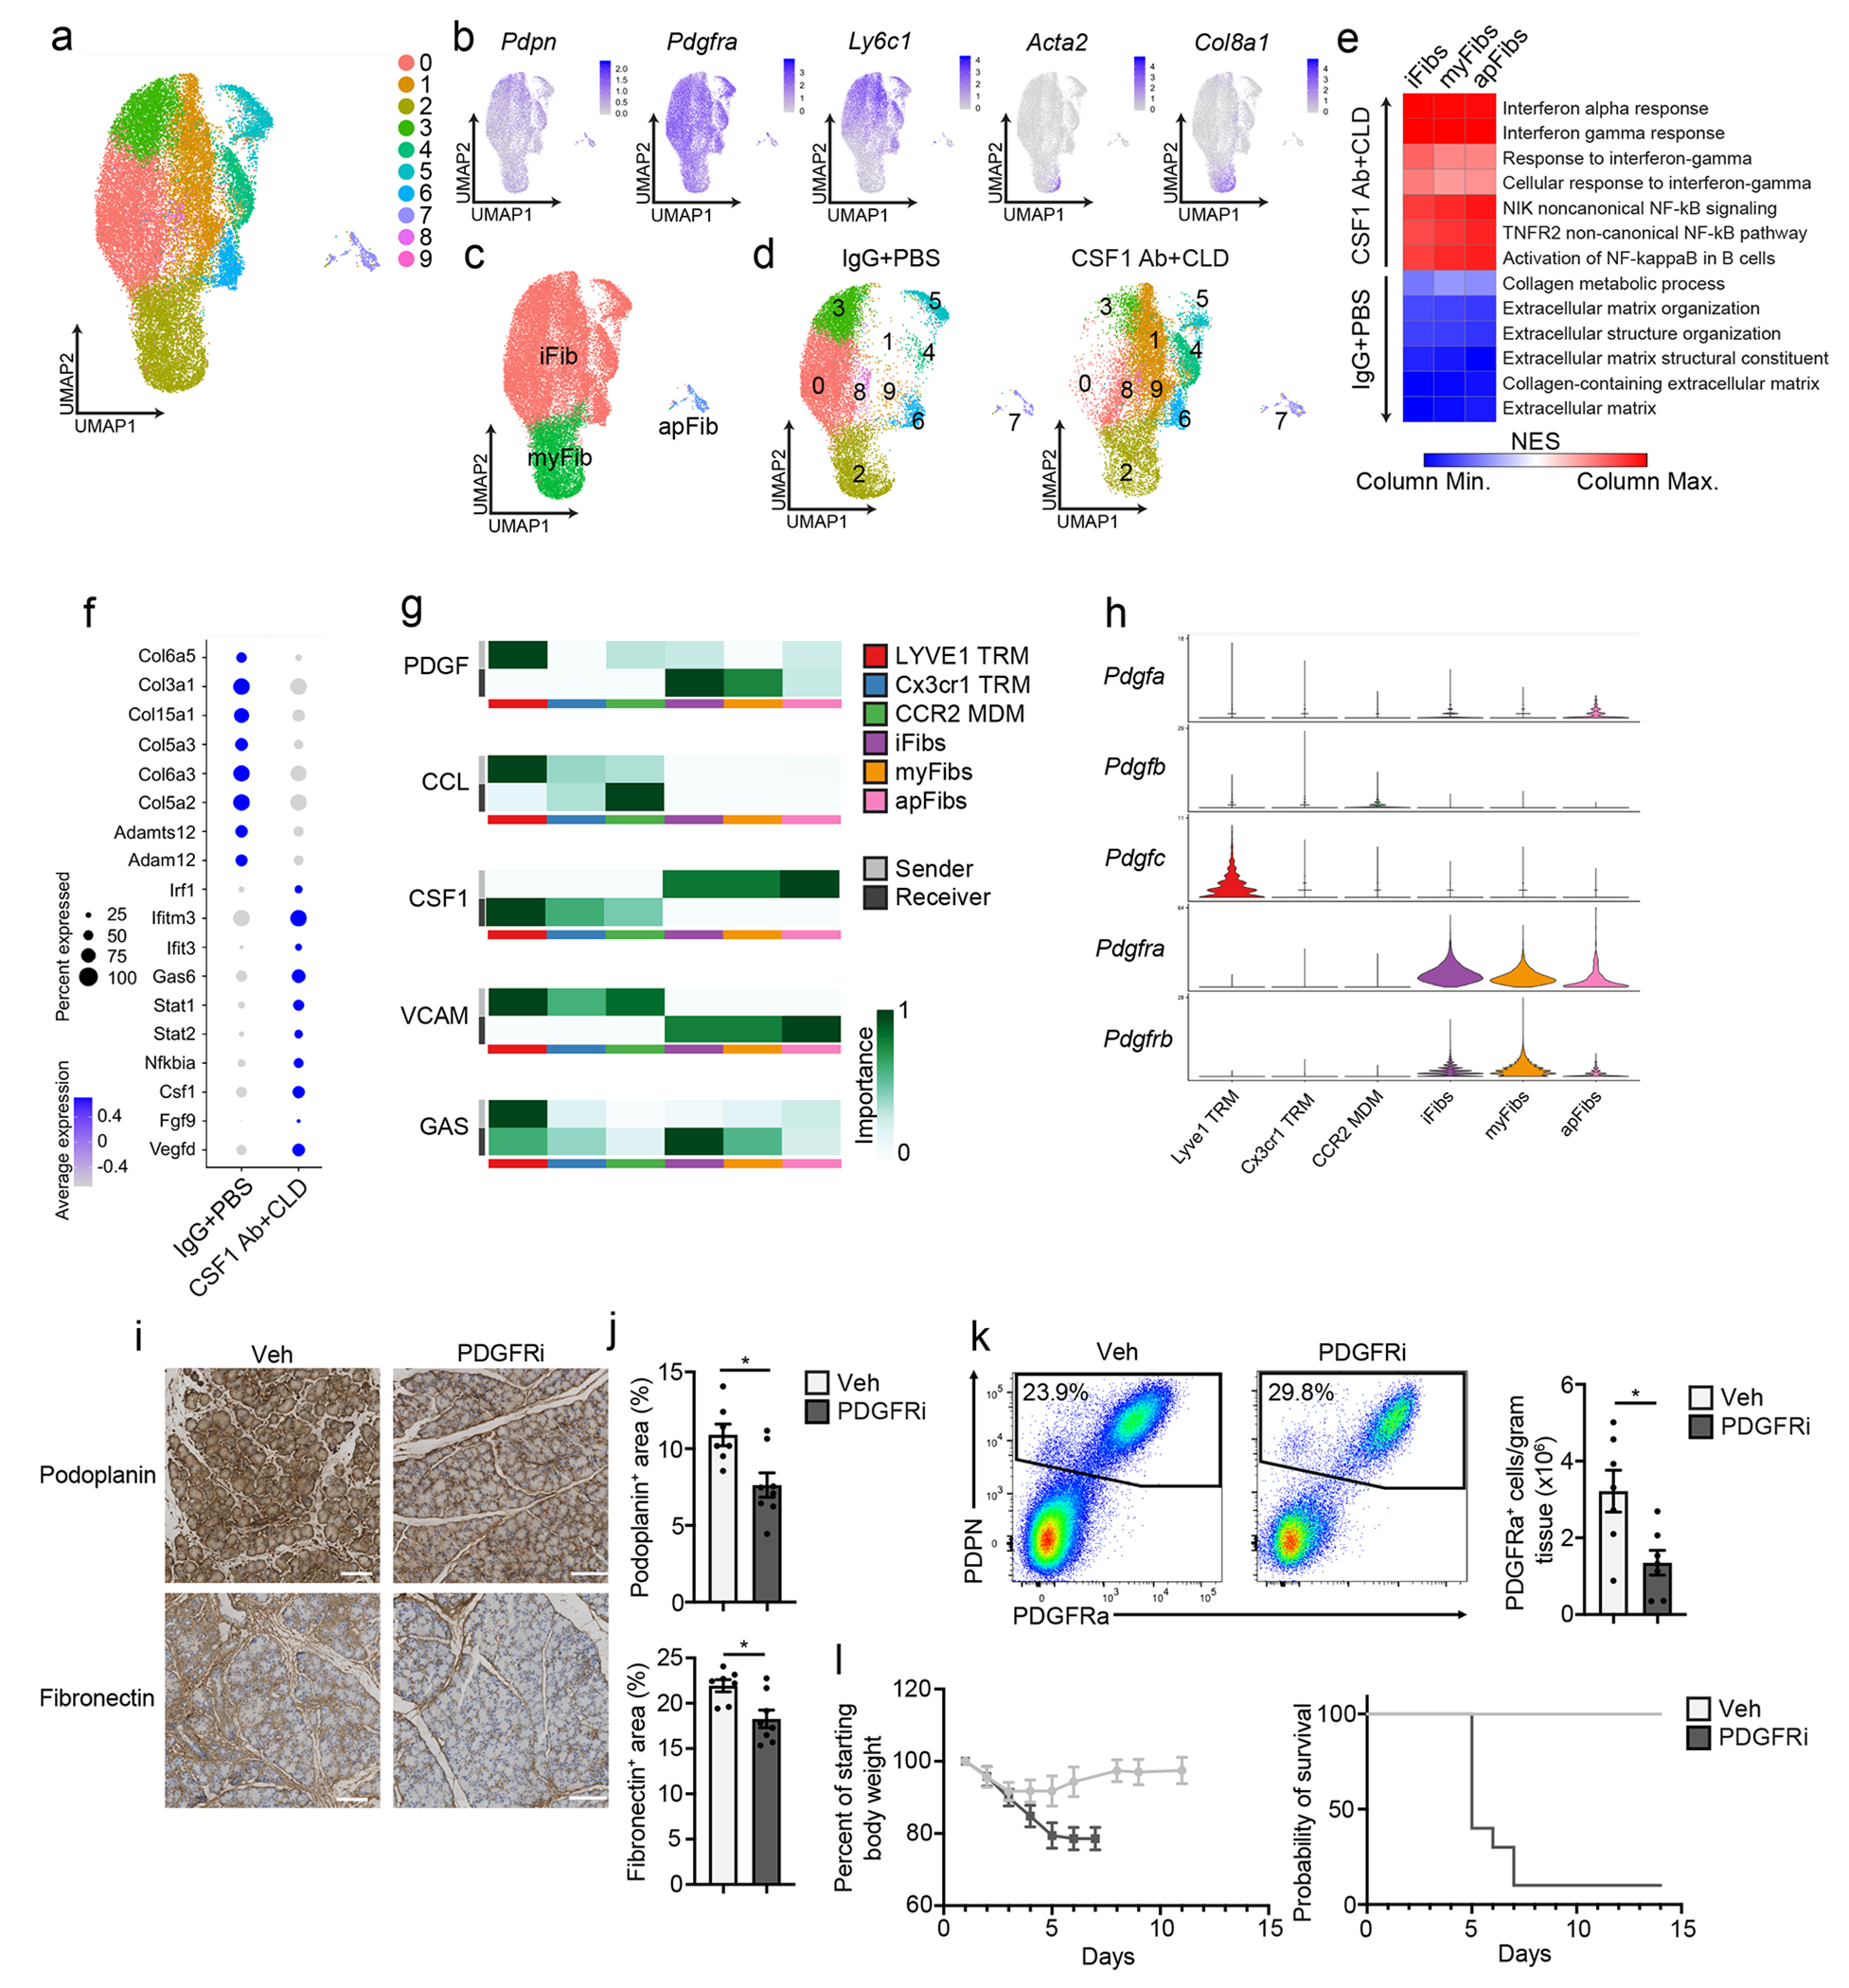
Figure 7: TRMs shape the tissue-protective fibrotic response.

a. UMAP plot of pancreas podoplanin+ fibroblasts sorted from IgG+PBS or CSF1 Ab+CLD treated mice rested for 10 days then administered 6 hourly i.p. injections of Cer every other day for one week. b. UMAP plots displaying Podoplanin, Pdgfra, Ly6c1, Acta2 and Col8a1 expression in podoplanin+ pancreas fibroblasts of IgG+PBS and CSF1 Ab+CLD-treated mice as in a. c. UMAP plot showing the classification of fibroblast clusters into Ly6C+ iFib, αSMA+ myFib and MHCII+ apFib subtypes in pancreas podoplanin+ fibroblasts of IgG+PBS and CSF1 Ab+CLD treated mice as in a. d. UMAP plot of pancreas podoplanin+ fibroblasts from IgG+PBS or CSF1 Ab+CLD mice as in a. e. Heatmap displaying NES of gene sets significantly enriched across podoplanin+ fibroblast subtypes (as in c) comparing IgG+PBS to CSF1 Ab+CLD samples. f. Dot plot of DEGs upregulated in podoplanin+ fibroblasts from IgG+PBS or CSF1 Ab+CLD-treated mice as in a. g. Heatmaps displaying relative importance of network centrality measures for sender (ligand signals) and receiver (receptors) across macrophage clusters from Flt3-YFP mice treated with Cer by 6 hourly i.p. injections every other day for one week (from Fig. 3c) and fibroblast clusters as in a for PDGF, CCL, CSF1, VCAM and GAS signaling pathway networks from CellChat analysis49. h. Violin plots showing expression of PDGF signaling pathway genes Pdgfa, Pdgfb, Pdgfc, Pdgfra and Pdgfrb across macrophage and fibroblast clusters as in g. i. Representative images of podoplanin or fibronectin-stained pancreas tissue from mice injected i.p with Veh or PDGFRi once per day along with 6 hourly Cer i.p. injections every other day for one week. Scale bars, 100μM. j. Quantification of podoplanin+ and fibronectin+ area in pancreas tissue of mice treated with Veh or PDGFRi and cerulein as in i; Veh, n=7 mice; PDGFRi, n=8 mice; *P=0.0205 in podoplanin analysis and *P=0.0140 in fibronectin analysis. k. Flow cytometry of podoplanin+ fibroblasts and density of PDGFRa+ fibroblasts from mice treated with Veh or PDGFRi along with Cer as in i,; n=7 mice/group and *P=0.0175. l. Body weight measurement and Kaplan-Meier survival curve in mice treated with Veh or PDGFRi along with 10μg/day Cer delivered by peritoneal osmotic pumps. Measurements start on day of osmotic pump implantation; n=10 mice/group, *P<0.0001 comparing vehicle and PDGFRi in survival curve. Data are presented as mean ± SEM unless otherwise indicated. n.s., not significant; *p <0.05. For comparisons between two groups, Student’s two-tailed t-test was used, except for f, where Bonferroni correction was used, and e, where FDR was used.
