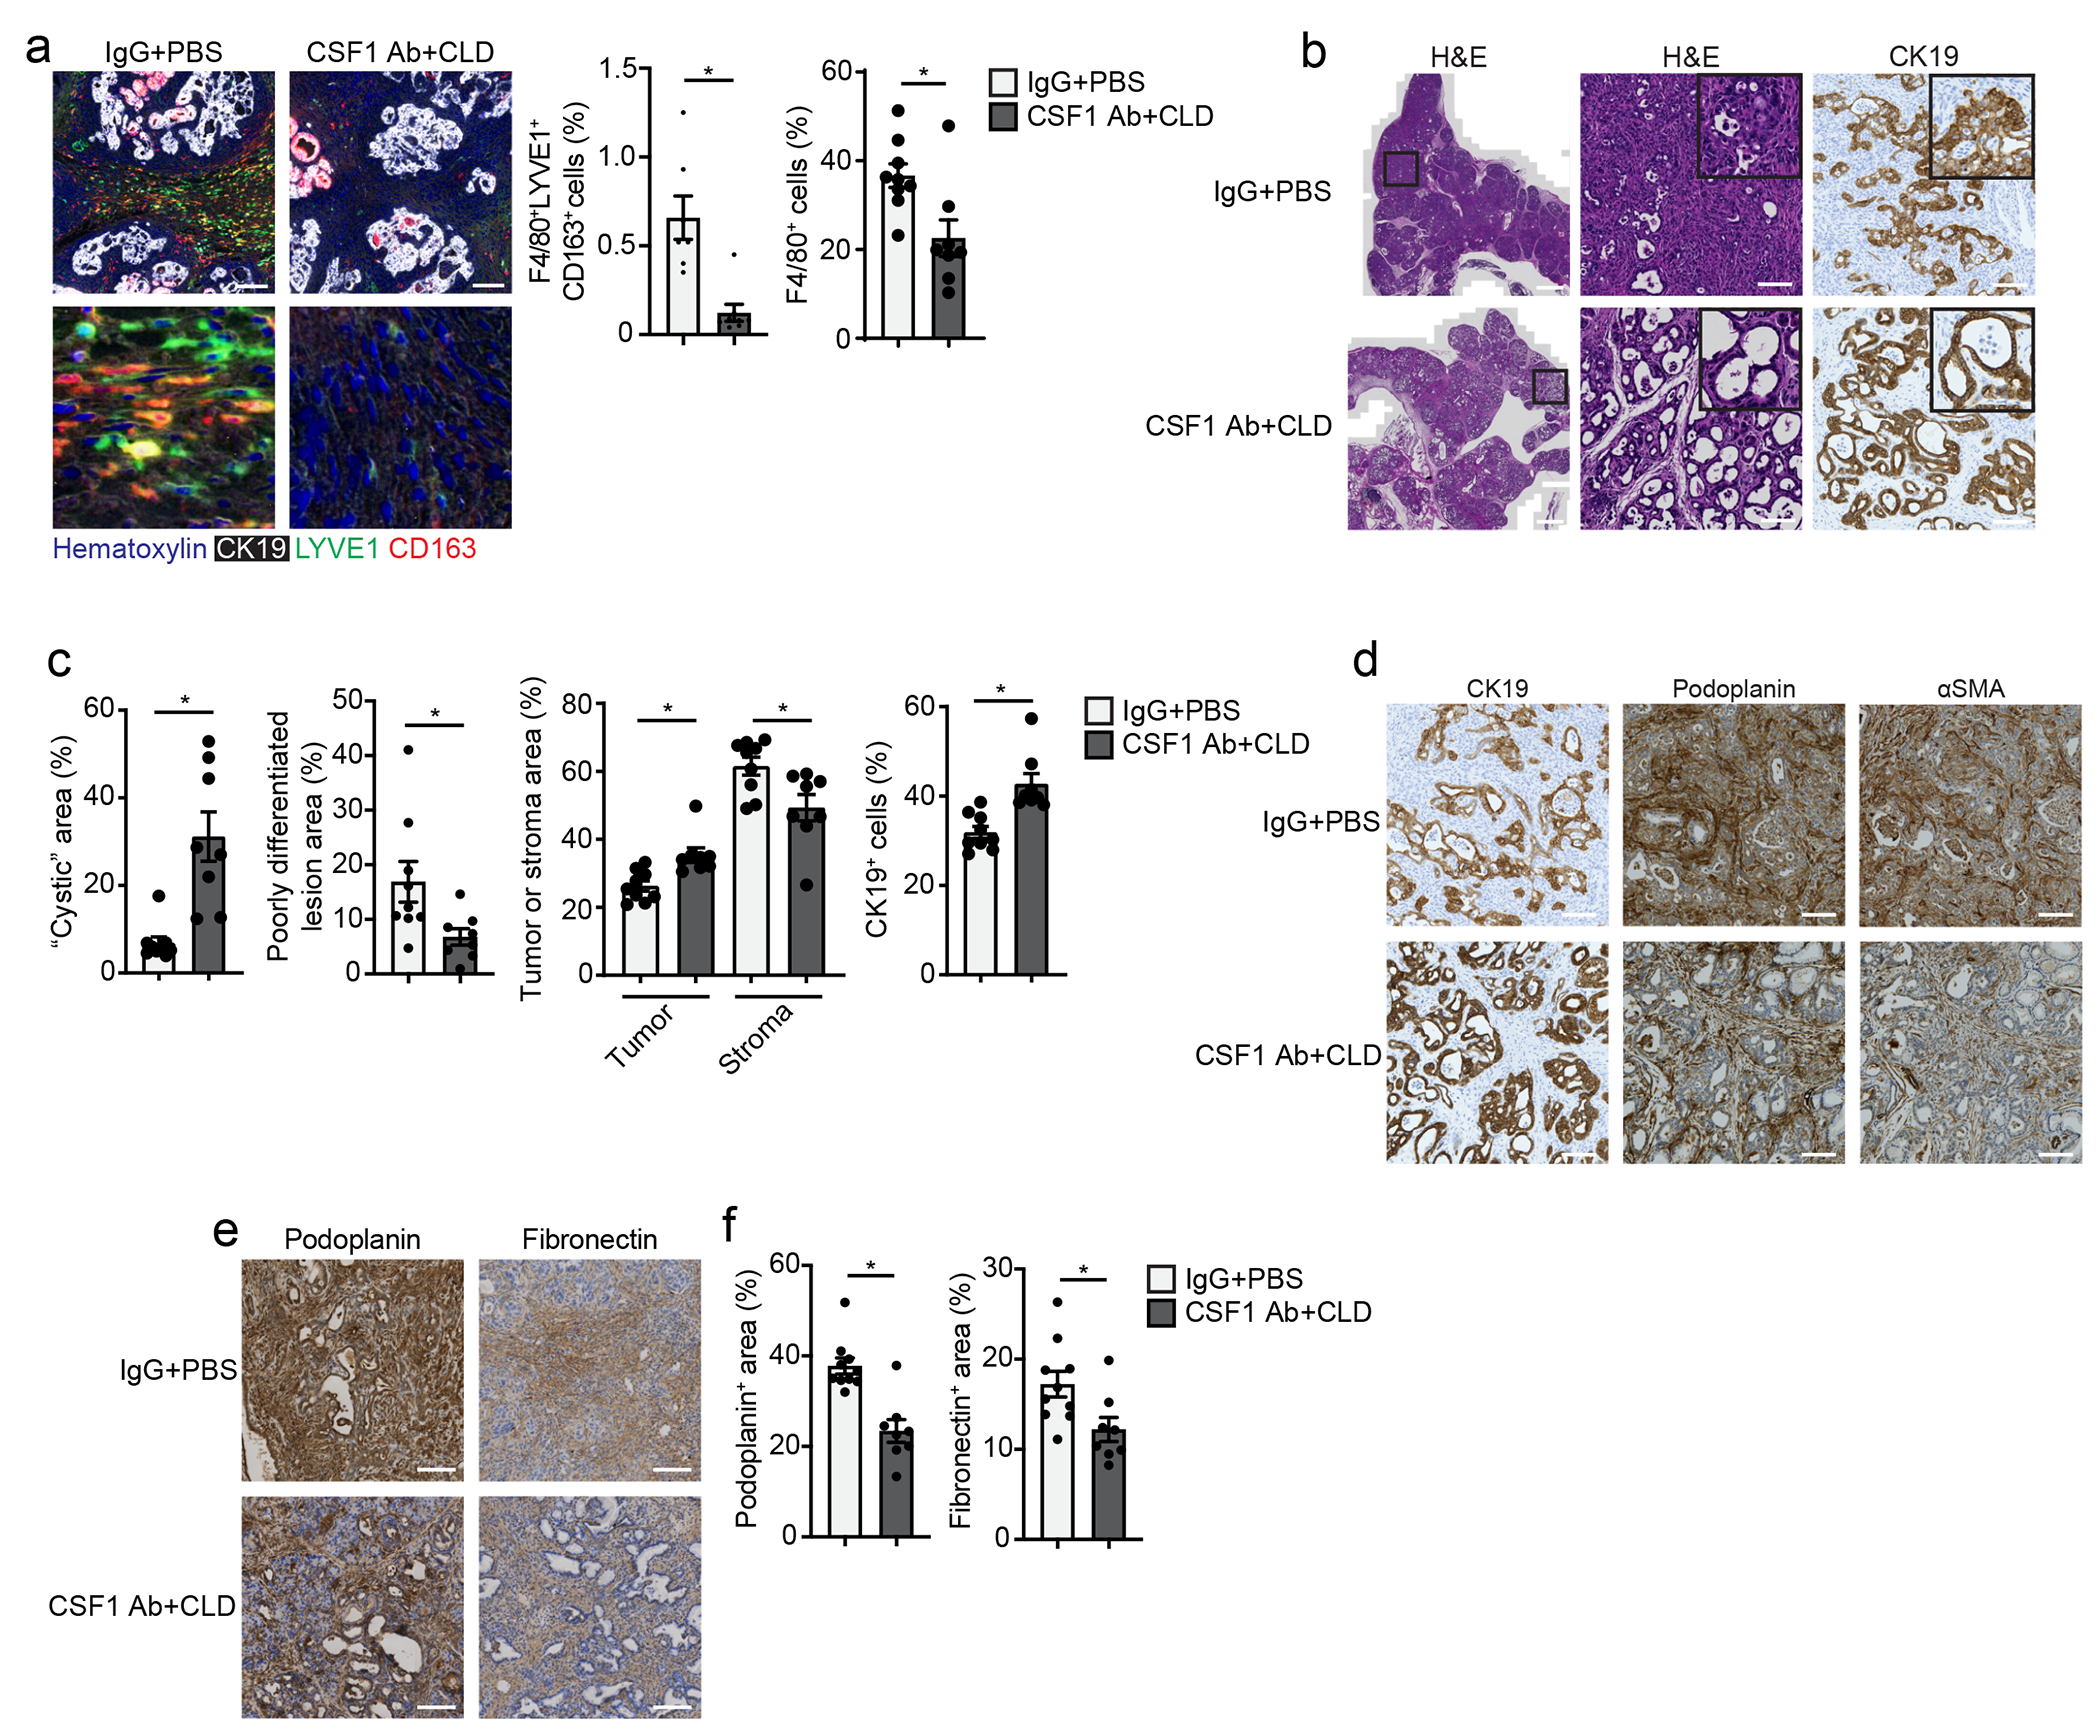
Figure 8: TRMs drive fibrosis and pancreatitis-accelerated PDAC progression.

a. Representative mIHC images of pancreas tissue stained for hematoxylin, CK19, F4/80, LYVE1 and CD163 and quantification of F4/80+LYVE1+CD163+ macrophages and F4/80+ macrophages, displayed as the percentage of cells, from 2.5 month old p48-Cre LSL-KRASG12D p53fl/+ (hereafter KPC) mice treated with IgG+PBS or CSF1 Ab+CLD, recovered for 10 days then treated with 6 hourly i.p. injections of Cer every other day for 5 days; F4/80+LYVE1+CD163+ macrophage analysis: IgG+PBS, n=7; CSF1 Ab+CLD, n=8 mice; *P=0.0012; F4/80+ macrophage analysis: IgG+PBS, n=9; CSF1 Ab+CLD, n=8 mice; *P=0.0079. Scale bar, 100μM. b. Representative images of pancreas tissue stained for H&E or CK19 from IgG+PBS or CSF1 Ab+CLD-treated KPC mice as in a. Scale bars are 1mm (left column) or 100μM (right two columns). c. Quantification of tumor area presenting cyst-like appearance, poorly differentiated/high grade invasive pancreatic tumor lesions, tumor lesions and stromal areas as percent of total pancreas area, and CK19+ cells as percentage of total cells in IgG+PBS or CSF1 Ab+CLD-treated KPC mice as in a; IgG+PBS, n=9 mice; CSF1 Ab+CLD, n=8, left to right, *P=0.0003 for cystic area analysis, *P=0.0079 for poorly differentiated area analysis, *P=0.0010 and *P=0.0152 for tumor and stromal area analysis, and *P=0.0003 for CK19 analysis. d. Representative images of pancreas tissue stained for CK19, podoplanin or αSMA from IgG+PBS or CSF1 Ab+CLD-treated KPC mice as in a, scale bars are 100μM. e. Representative images of pancreas tissue from 2 month old p48-Cre LSL-KRASG12D p53fl/fl (KPPC) mice treated with IgG+PBS or CSF1 Ab+CLD at 1 month of age and rested for 4 weeks. Scale bars are 100μM. f. Quantification of podoplanin+ or fibronectin+ area in KPPC mice treated with IgG+PBS or CSF1 Ab+CLD as in e. IgG+PBS, n=10 mice; CSF1 Ab+CLD, n=8, *P=0.0014 for podoplanin analysis and *P=0.0205 for fibronectin analysis. Data are presented as mean ± SEM unless otherwise indicated. n.s., not significant; *p <0.05. For comparisons between two groups, Student’s two-tailed t-test was used.
