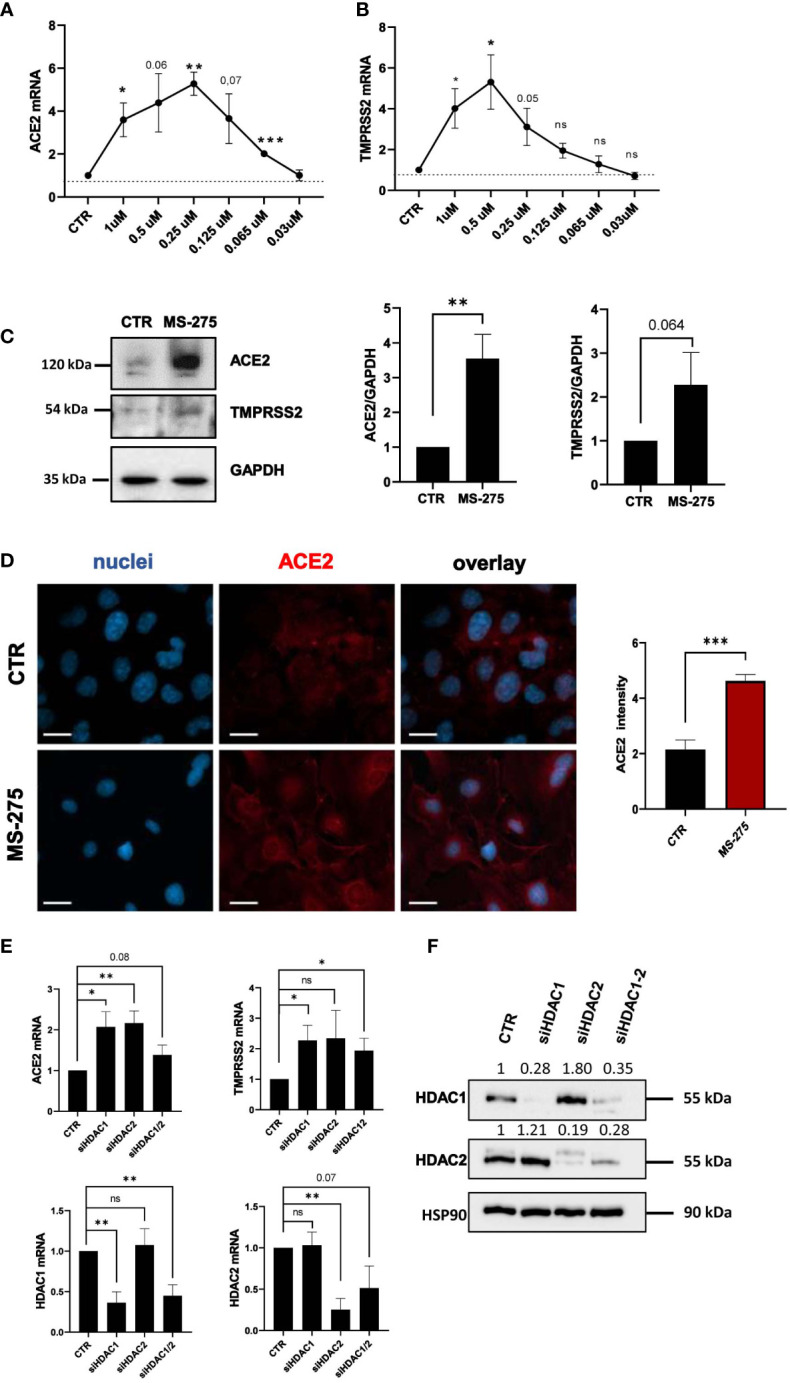
Figure 2.

Treatment with MS-275 and genetic silencing of HDAC1 and HDAC2 enhances the expression of ACE2 and TMPRSS2. (A, B) MeT5A cells were treated with DMSO or MS-275 for 48 hours at the following doses: 1, 0.5, 0.25, 0.125, 0.065, and 0.03 μM. Quantitative RT-PCR expression analysis of ACE2 and TMPRSS2 was performed from total RNA of MS-275-treated MeT5A cells compared to DMSO-treated samples (CTR). L34 mRNA levels were used for normalization. Bars represent the mean ± SEM of triplicate determinations from three independent experiments. P was calculated with respect to CTR. Differences were considered significant at p < 0.05. *P< 0.05; **P< 0.01; ***P< 0.001; ns, not significant. (C) Left: Western blot showing the expression of ACE2 and TMPRSS2 from total cellular extracts of MeT5A cells treated for 48 hours with 0,25 μM DMSO or 0.25 μM MS-275. GAPDH was detected as a loading control. Right: quantification of ACE2 and TMPRSS2 protein expression. Bars represent the mean ± SEM of triplicate determinations in four independent experiments. P was calculated with respect to CTR samples. (D) Immunofluorescence of MeT5A cells treated with 0.25 μM MS-275 for 48 hours compared to CTR. Left: Fixed cells were stained with antibodies against ACE2. Nuclei were stained with DRAQ5. A minimum of 150 cells per sample from two independent experiments were analyzed. Scale bar: 25 μm. Right: ACE2 fluorescence signal quantification in MS-275 treated cells compared to CTR. Bars represent the mean ± SEM of triplicate determinations. P was calculated with respect to CTR-infected samples. Differences were considered significant at p < 0.05. *P< 0.05; **P< 0.01; ***P< 0.001; ns, not significant. (E) Cells were treated with gene silencing SMARTpool to silence HDAC1 and/or HDAC2 gene expression. Quantitative RT-PCR expression analysis of ACE2, TMPRSS2, HDAC1, and HDAC2 from total RNA of treated MeT5A cells compared to control treatment (CTR). L34 mRNA levels were used for normalization. Bars represent the mean ± SEM of triplicate determinations from six independent experiments. P was calculated with respect to CTR samples. Differences were considered significant at p < 0.05. *P< 0.05; **P< 0.01; ***P< 0.001; ns, not significant. (F) Western blot showing the expression of HDAC1 and HDAC2 from total cellular extracts of genetically silenced MeT5A cells. HSP90 was detected as a loading control.
