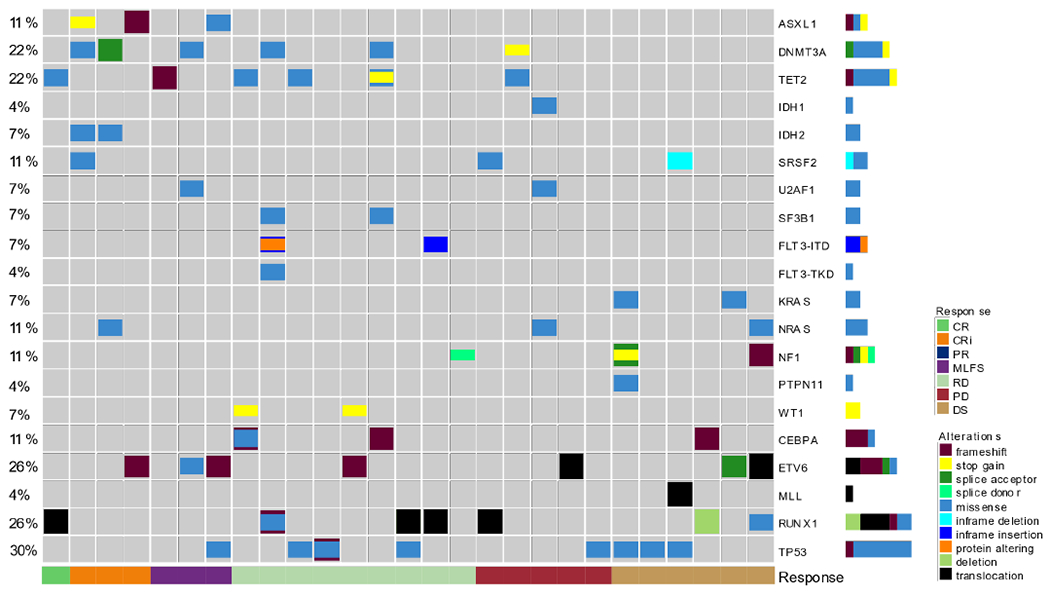
Figure 3.

Molecular patterns of response. Heatmap showing the frequency of molecular markers detected at baseline for each patient as it relates to best response on study, which is color coded on the bottom. The molecular marker is on the right and the frequency is on the left, with the colors indicating the type of alteration. CR, complete response; CRi, CR with incomplete hematologic recovery; PR, partial response; MLFS, morphologic leukemia-free state; RD, resistant disease; PD, progressive disease; DS, discontinued with no response data.
