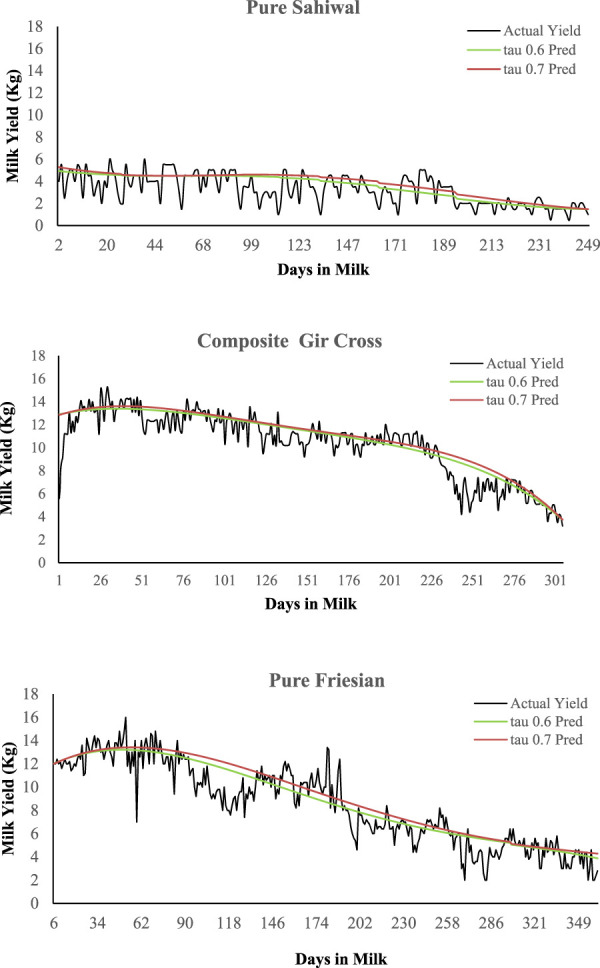
FIGURE 1.

Examples of actual and modeled lactation curves of animals of different breed groups. Lactation curves were modeled using quantile regression method. Two quantiles, 0.6 (tau 0.6 Pred) and 0.7 (tau 0.7 Pred) were tested before settling on quantile 0.7 upon visual inspection.
