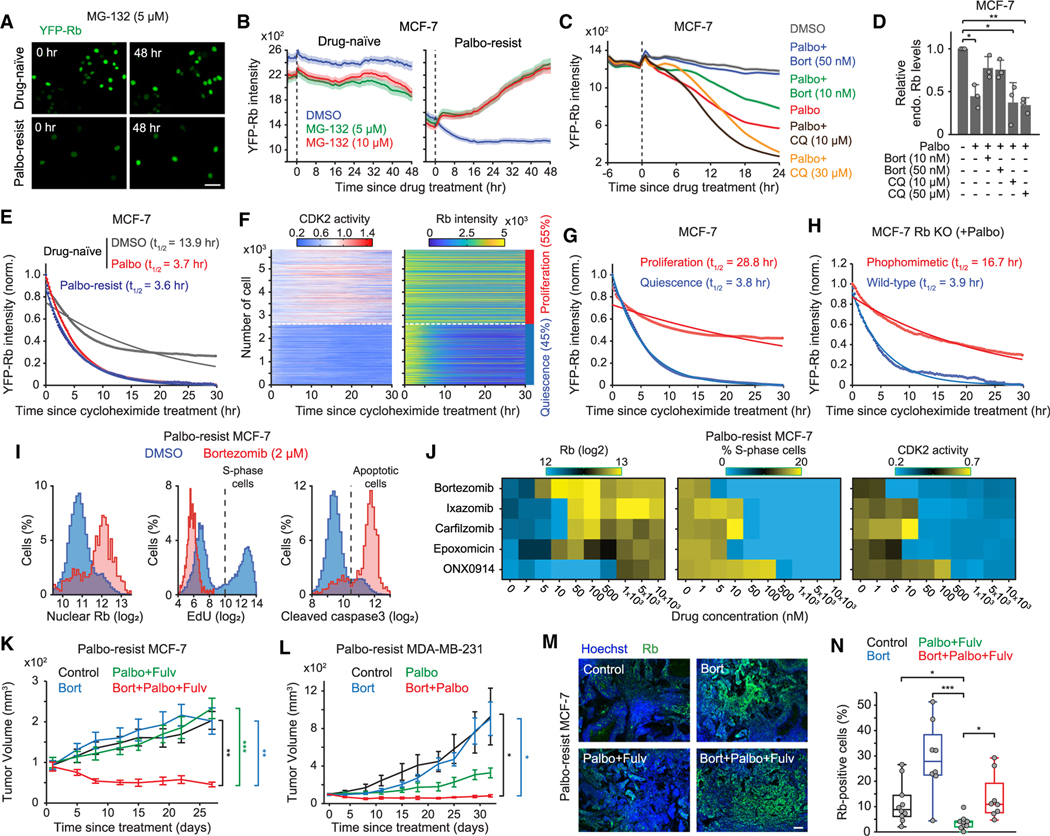
Figure 3. A combination of CDK4/6 and proteasome inhibitors suppresses Rb-protein reduction and the cell growth of drug-resistant cells.
(A) Representative images of YFP-Rb in drug-naive and palbociclib-resistant MCF-7 cells before and after 48 h treatment with MG-132 (5 μM). Scale bar represents 100 μm.
(B) Averaged traces of YFP-Rb intensities following DMSO and MG-132 treatment. Data are shown as means ±95% CI (n > 4,000 cells/condition).
(C) Average traces of YFP-Rb intensities in drug-naive MCF-7 cells treated with combinations of palbociclib (1 μM), bortezomib, and chloroquine. Data are shown as means ±95% CI (n > 4,500 cells/condition).
(D) Relative endogenous Rb levels in drug-naive MCF-7 cells after treating with indicated drugs for 24 h. Data are shown as means ± SD (n = 3 biological replicates). p values were calculated by one-way ANOVA (*p ≤ 0.05; **p ≤ 0.001).
(E) YFP-Rb protein turnover. Drug-naive cells were treated with DMSO or palbociclib (1 μM) for 24 h before treatment with cycloheximide (10 μg/mL). Mean YFP-Rb levels were normalized with the initial and minimal values. Solid lines represent the best-fitted lines (n > 130 cells/condition).
(F) Heatmaps of single-cell traces for CDK2 activity and YFP-Rb intensity. Percentages indicate the proportion of proliferating (CDK2 activity >1.0 for over 2 h) and quiescent (no CDK2 activation) cells, classified based on CDK2 activity 15–30 h after treatment with cycloheximide.
(G) YFP-Rb protein turnover in proliferating and quiescent cells (n > 2,500 cells/condition).
(H) Turnover of wild-type or phosphomimetic Rb protein in Rb-knockout MCF-7. Cells were treated with palbociclib (1 μM) for 24 h before treatment with cycloheximide (10 μg/mL) (n > 130 cells/condition).
(I) Histogram of nuclear Rb, EdU, and cleaved caspase-3 staining in palbociclib-resistant MCF-7 cells 48 h after treatment with either DMSO or bortezomib (2 μM) (n > 1,100 cells/condition).
(J) Heatmaps of nuclear Rb levels, percentage of S-phase cells, and CDK2 activity. Palbociclib-resistant MCF-7 cells were treated with proteasome inhibitors (0–10 μM) for 48 h (n > 1,000 cells/condition).
(K and L) Growth curve of tumor volume in mice injected with palbociclib-resistant MCF-7 (K) or MDA-MB-231 (L) cells. Data are means ± SEM (K: control, n = 10 mice; bortezomib [bort], n = 8 mice; palbociclib [palbo] + fulvestrant [fulv], n = 9 mice; bort + palbo + fulv, n = 9 mice; L: control, n = 6 mice; bort, n = 5 mice; palbo, n = 4 mice; bort + palbo, n = 6 mice). p values were calculated by two-sided one-way ANOVA (*p ≤ 0.05; **p ≤ 0.001; ***p ≤ 0.0001).
(M) Representative images of Hoechst and Rb staining in tumor tissues. Scale bar represents 100 μm.
(N) Boxplot of Rb-positive-cell percentage from whole-tumor section (control, n = 10 mice; bort, n = 8 mice; palbo + fulv, n = 9 mice; bort + palbo + fulv, n = 8 mice). p values were calculated by two-tailed unpaired t tests (*p ≤ 0.05; ***p ≤ 0.0001).

