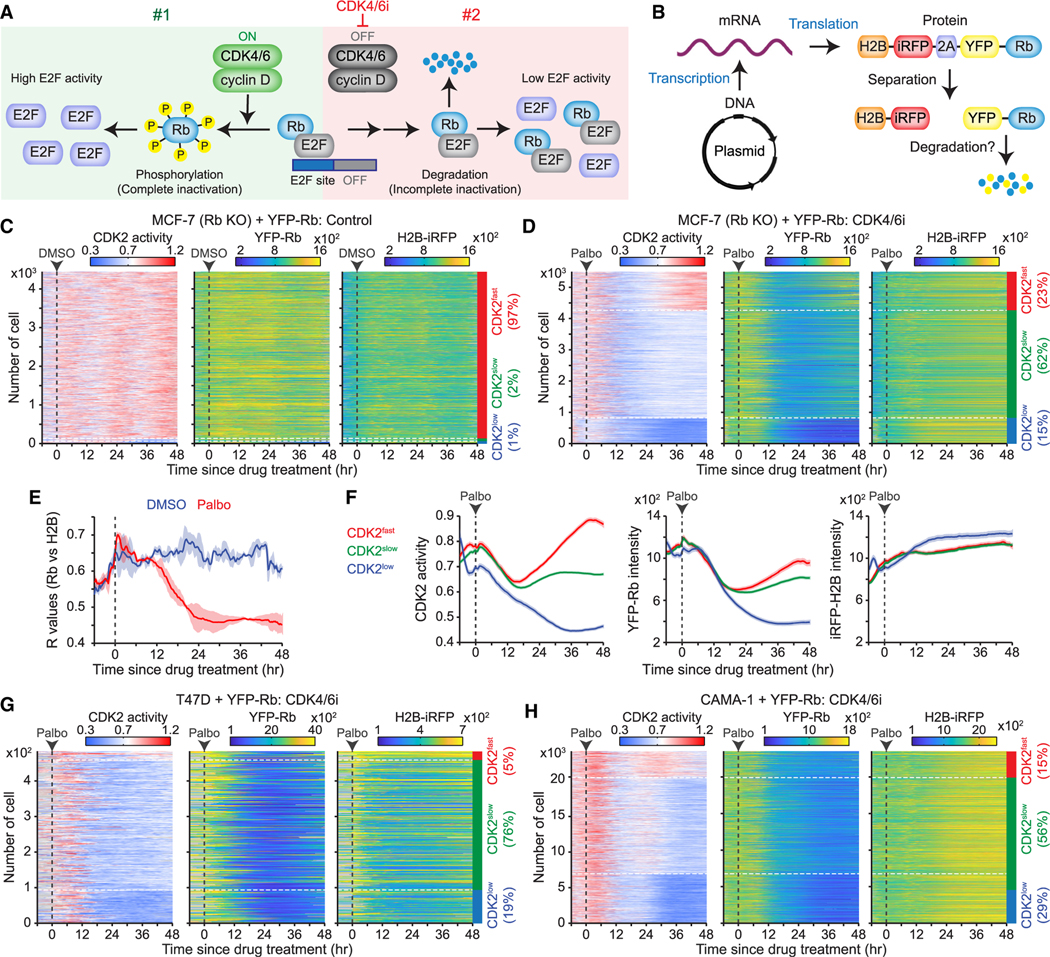
Figure 5. Breast cancer cells entering quiescence induces Rb-protein reduction.

(A) Schematic representation of our hypothesis showing two Rb inactivation pathways by active CDK4/6 (#1) and proteolytic degradation of Rb (#2).
(B) Schematic illustration of a plasmid-encoded construct designed to assess post-translational Rb degradation.
(C and D) Heatmaps of single-cell traces for CDK2 activity and YFP-Rb and H2B-iRFP intensities over time. Rb-knockout MCF-7 cells expressing the H2B-iRFP-p2a-YFP-Rb construct treated with either DMSO (C) or palbociclib (1 μM) (D). CDK2fast (CDK2 activity >0.8 for over 2 h), CDK2slow (CDK2 activity >0.6 for over 2 h), and CDK2low (no CDK2 activation) cells were classified based on CDK2 activity 30–48 h post-treatment.
(E) Averaged correlation (R) values between YFP-Rb and H2B-iRFP intensities following DMSO or palbociclib (1 μM) treatment. Data are shown as means ± SD (n = 2 biological replicates).
(F) Average traces of CDK2 activity and YFP-Rb and H2B-iRFP intensities, based on the CDK2 classification after palbociclib (1 μM) treatment (n > 800 cells/condition).
(G and H) Heatmaps of single-cell traces for CDK2 activity and YFP-Rb and H2B-iRFP intensities in T47D (G) and CAMA-1 (H) cells treated with palbociclib (1 μM).
See also Figure S7.
