
FIGURE 3.
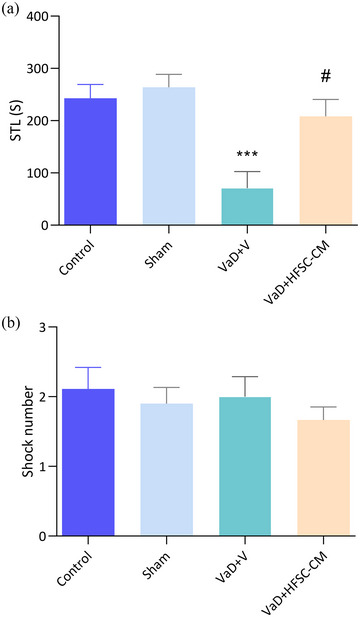
The passive‐avoidance test. The step‐through latency (STL) (a) and shock number (b) in the studied groups. The values are shown as mean ± SEM. Significant differences with respect to the sham (***p < .001) and vascular dementia (VaD) + V (#p < .05), control (n = 9), sham‐operation (sham, n = 10), VaD + V (n = 9), and VaD + hair follicular stem cell (HFSC)‐conditioned medium (CM) (n = 12). One‐way ANOVA with the Tukey's post hoc test.