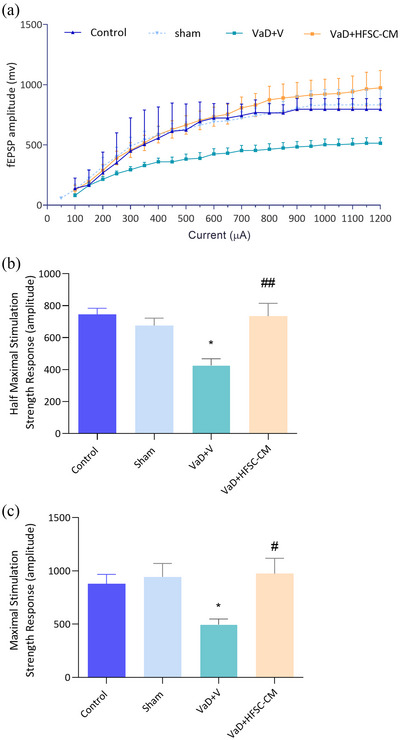
FIGURE 5.

The basal synaptic transmission (BST) of CA1 neurons was assessed through the input/output curve (a). The half (b) and maximum (c) stimulation field excitatory postsynaptic potential (fEPSP) amplitude. Significant differences with respect to the sham (*p < .05) and vascular dementia (VaD) + V (#p < .05, ##p < .01). The values are shown as mean ± SEM. Significant differences with respect to the sham (*p < .05) and VaD + V (#p < .05, ##p < .01), control (n = 9), sham‐operation (sham, n = 10), VaD + V (n = 9), and VaD + hair follicular stem cell (HFSC)‐conditioned medium (CM) (n = 10). One‐way ANOVA with the Tukey's post hoc test.
