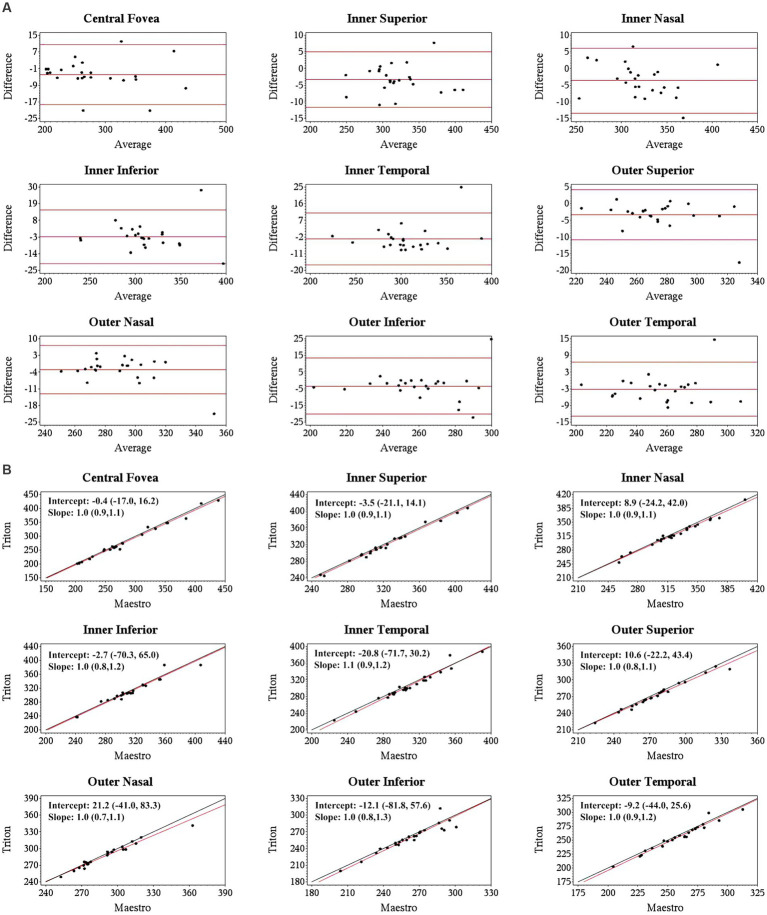
Figure 1.
Agreement of full retina thickness measurements from the wide scan between Triton SS-OCT and Maestro SD-OCT in eyes with retinal disease. (A) Bland–Altman plots show all the average measurement differences between the two devices are less than 4 μm. (B) Deming regression plots of full retina thickness from the wide scan. The plots illustrate the fitted linear models (red line) and the identity lines (Triton measurement = Maestro measurement, slope = 1) (black line). Intercepts and slops are shown as mean (95% confidence interval). All slopes are very close to +1.

