Fig. 1.
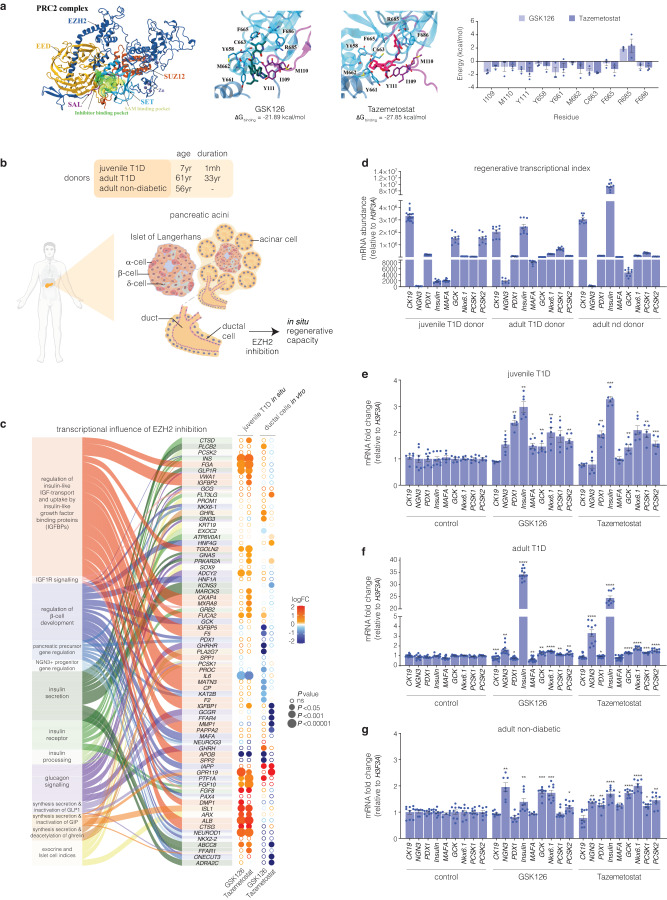
Inhibition of EZH2 by GSK126 and Tazemetostat reactivates the expression of endocrine markers in exocrine cells. a Structure of the human polycomb repressive 2 (PRC2) complex composed of EZH2 (dark blue), EED (light orange), and SUZ12 (dark orange) displayed in cartoon representation. The catalytic SET domain (cyan) and the SET activation loop (SAL, purple) of EZH2 are highlighted. The binding pocket for pyridine inhibitors partially overlaps with the SAM binding pocket, shown in surface representation. Binding free energies of GSK126 and Taz were calculated with MM-PBSA. Binding energy was decomposed on a per-residue basis, with energies for residues of the SET and SAL domains displayed as mean ± SEM. Structures of GSK126 (teal), Taz (magenta), and residues of the SET (cyan) and SAL (purple) domains are shown as sticks. b Schematic of human exocrine tissue isolation from Type 1 diabetic (T1D) and non-diabetic donors featuring the in vivo location of ductal cells stimulated by EZH2 inhibitors. c RNA-seq analysis showing differential expression of canonical β-cell and exocrine markers derived from Reactome database in T1D pancreatic tissue and human pancreatic ductal epithelial cells following EZH2 inhibition using GSK126 or Taz. The left panel illustrates the association of functional pathway descriptors with individual genes. The right panel displays differential gene expression by inhibitor group in circular format. Log2 fold change (logFC) is represented by a diverging red (increase) – blue (decrease) colour gradients. Expression significance (decreasing P-value) is illustrated by larger circular diameter. Hollow circles are non-significant change (ns = P > 0.05). d Comparison of mRNA expression levels of key regenerative genes that include CK19, NGN3, PDX1, INS, MAFA, GCK, NKX6.1, PCSK1 and PCSK2 relative to H3F3A in T1D and non-diabetic donors before EZH2 inhibitor stimulation. Insulin (INS) expression is barely detectable in juvenile T1D and significantly reduced in adult T1D donor when compared to the non-diabetic donor. Data are represented as mean of experiments performed using non-diabetic and T1D donors with 3 technical replicates, error bars are S.E.M. e Fold change in the transcriptional expression index of CK19, NGN3, PDX1, INS, MAFA, GCK, NKX6.1, PCSK1, and PCSK2 relative to H3F3A mRNA in juvenile T1D donor. Data are represented as mean of experiments conducted in non-diabetic and T1D donors. EZH2 inhibition studies were repeated 3 times with technical replicates. Statistical significance was calculated by comparing control vs inhibitor values using Student t-test, *P < 0.05, **P < 0.01, ***P < 0.001, error bars are S.E.M. f Fold change in the transcriptional expression index of CK19, NGN3, PDX1, INS, MAFA, GCK, NKX6.1, PCSK1 and PCSK2 in adult T1D donor, displayed as fold change relative to H3F3A mRNA levels. Data are represented as mean of experiments conducted in non-diabetic and T1D donors. EZH2 inhibition studies were repeated repeated 3 times with technical replicates. Statistical significance was calculated by comparing control vs inhibitor values using Student t-test, *P < 0.05, **P < 0.01, ***P < 0.001, ****P < 0.0001, error bars are S.E.M. g Fold change in the transcriptional expression index of CK19, NGN3, PDX1, INS, MAFA, GCK, NKX6.1, PCSK1 and PCSK2 in adult non-diabetic donor, shown as fold change relative to H3F3A mRNA levels. Data are represented as mean of experiments conducted in non-diabetic and T1D donors. EZH2 inhibition studies were repeated repeated 3 times with technical replicates. Statistical significance was calculated by comparing control vs inhibitor values using Student t-test, *P < 0.05, **P < 0.01, ***P < 0.001, ****P < 0.0001, error bars are S.E.M

