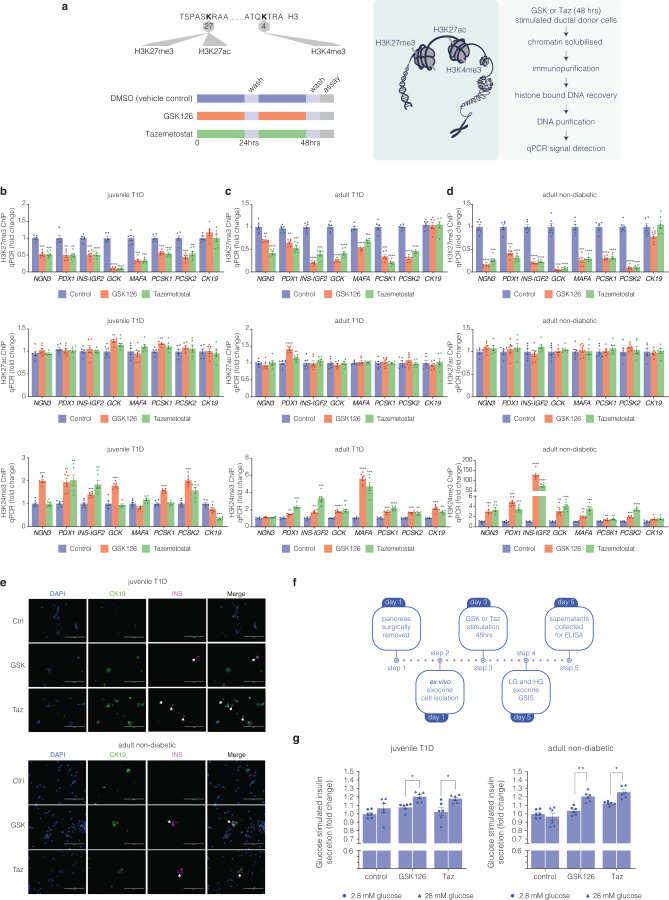
Fig. 2.
Bivalent chromatin protects regenerative exocrine capacity and insulin expression from default transcriptional suppression. a Schematic of histone tail modification for H3K27me3, H3K27ac and H3K4me3 content. Also shown is the protocol used to stimulate CK19+ve ductal cells derived from juvenile and adult T1D donors with EZH2 inhibitors for 48 h and assessed for chromatin content, immunofluorescence and GSIS assays. b GSK126 and Taz influences bivalent chromatin domains in human exocrine CK19+ve cells derived from juvenile T1D donor. Quantitative PCR analyses of DNA in ChIP using anti-H3K27me3, anti-H3K27ac and anti-H3K4me3 antibodies for NGN3, PDX1, INS-IGF2, MAFA, GCK, PCSK1, PCSK2, and CK19 are displayed as fold change calculated and adjusted to control values. Data are represented as mean ± S.E.M. of percent input (EZH2 inhibition; n = 6). Vehicle control was DMSO. Statistical significance was calculated by comparing control vs GSK126 or Tazemetostat using Student t-test, *P < 0.05, **P < 0.01, ***P < 0.001, ****P < 0.0001. c GSK126 and Taz influences bivalent chromatin domains in human exocrine CK19+ve cells derived from adult T1D donor. Quantitative PCR analyses of DNA in ChIP using anti-H3K27me3, anti-H3K27ac and anti-H3K4me3 antibodies for NGN3, PDX1, INS-IGF2, MAFA, GCK, PCSK1, PCSK2, and CK19 are displayed as fold change calculated and adjusted to control values. Data are represented as mean ± S.E.M. of percent input (EZH2 inhibition; n = 6). Vehicle control was DMSO. Statistical significance was calculated by comparing control vs GSK126 or Tazemetostat using Student t-test, **P < 0.01, ***P < 0.001, ****P < 0.0001. d GSK126 and Taz influences bivalent chromatin domains in human exocrine CK19+ve cells derived from adult non-diabetic donor. Quantitative PCR analyses of DNA in ChIP using anti-H3K27me3, anti-H3K27ac and anti-H3K4me3 antibodies for NGN3, PDX1, INS-IGF2, MAFA, GCK, PCSK1, PCSK2, and CK19 are displayed as fold change calculated and adjusted to control values. Data are represented as mean ± S.E.M. of percent input (EZH2 inhibitor stimulation; n = 6). Statistical significance was calculated by comparing control vs GSK126 or Tazemetostat using Student t-test, *P < 0.05, **P < 0.01, ***P < 0.001, ****P < 0.0001. e GSK126 and Taz stimulate insulin protein expression in CK19+ve cells derived from juvenile T1D and adult non-diabetic donors. DAPI served as a control for nuclear staining. Images are representative of pharmacological EZH2 inhibition (n = 3). Scale bar represents 100 μm. White arrows point to CK19+INS+ cells. f Glucose responsiveness in exocrine tissue was assessed through a 5-step process: Day 1 pancreatic removal and isolation followed by 48-hour stimulation with GSK126 or Tazemetostat. The assay for glucose-stimulated insulin secretion was performed on Day 5, using low and high-glucose Kreb’s buffer. Insulin concentration was determined by ELISA. g Fold change of insulin release in low (2.8 mM) and high (28 mM) glucose conditions from GSK126 and Taz stimulated cells in juvenile T1D and adult non-diabetic donors. Data of two replicate experiments represented as mean ± S.E.M of fold change relative to control. Statistical significance was calculated by comparing 2.8 mM vs 28 mM glucose using Student t-test, *P < 0.05, **P < 0.01

