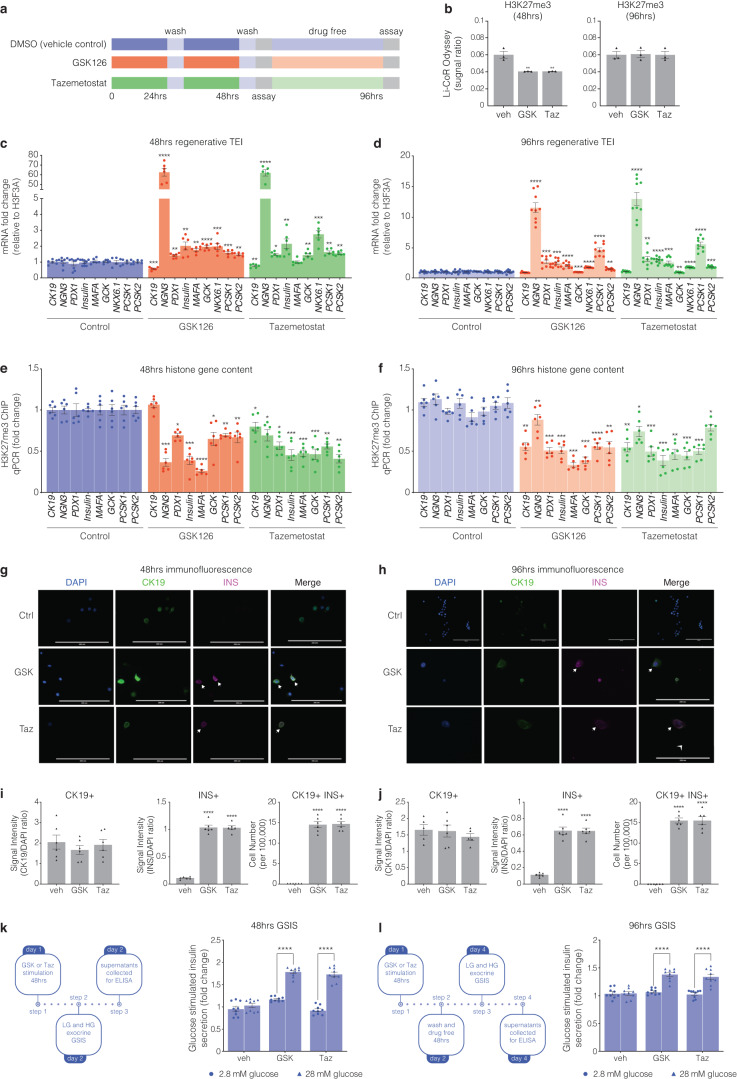
Fig. 3.
Human pancreatic ductal epithelial cells express β-cell indices in response to pharmacological EZH2 inhibition. a Cells were stimulated with GSK126 or Tazemetostat over a 48-hour period. Assays were then performed at the 48-hour time point as well as 48 h following drug free conditions at the 96-hour time point. b Histones were prepared by acid extraction. Quantification of H3K27me3 levels were calculated and adjusted to overall histone H3 using Li-COR Odyssey. The signal ratio for H3K27me3/total H3 was calculated at 48 and 96 h. Vehicle control is DMSO. Data are presented as mean with error bars as S.E.M of 3 replicates of stimulation. Statistical significance was calculated by comparing control vs inhibitor values using Student t-test, **P < 0.01. c Regenerative TEI of CK19, NGN3, PDX1, INS, MAFA, GCK, NKX6.1, PCSK1, and PCSK2 in pancreatic ductal cells after 48 h stimulation with GSK126 or Tazemetostat assessed by qRT-PCR, normalised to H3F3A and adjusted to controls. Data are represented as mean of 3 replicates. Statistical significance was calculated by comparing control vs inhibitor values using Student t-test, *P < 0.05, **P < 0.01, ***P < 0.001, ****P < 0.0001, error bars are S.E.M. d Regenerative TEI of CK19, NGN3, PDX1, INS, MAFA, GCK, NKX6.1, PCSK1, and PCSK2 in pancreatic ductal cells after 48 h stimulation with GSK126 or Tazemetostat followed by 48 h drug free conditions (96 h) assessed by qRT-PCR, normalised to H3F3A and adjusted to controls. Data are represented as mean of 3 replicates. Statistical significance was calculated by comparing control vs inhibitor values using Student t-test, **P < 0.01, ***P < 0.001, ****P < 0.0001, error bars are S.E.M. e Chromatin immunoprecipitation of H3K27me3 content for regenerative genes include CK19, NGN3, PDX1, INS-IGF2, MAFA, GCK, PCSK1, and PCSK2 in pancreatic ductal cells following 48 h of GSK126 or Taz stimulation assessed by qPCR and represented as fold change, normalised and adjusted to controls. Data are represented as mean ± S.E.M. of percent input (GSK126 or Taz stimulation; n = 3). Statistical significance was calculated by comparing control vs GSK126 or Taz using Student t-test, *P < 0.05, **P < 0.01, ***P < 0.001, ****P < 0.0001. f Chromatin immunoprecipitation of H3K27me3 content for regenerative genes include CK19, NGN3, PDX1, INS-IGF2, MAFA, GCK, PCSK1, and PCSK2 in pancreatic ductal cells after 48 h stimulation with GSK126 or Taz followed by 48 h drug free conditions (96 h) assessed by qPCR and represented as fold change, normalised and adjusted to controls. Data are represented as mean ± S.E.M. of percent input (GSK126 or Taz stimulation; n = 3). Statistical significance was calculated by comparing control vs GSK126 or Taz using Student t-test, *P < 0.05, **P < 0.01, ***P < 0.001, ****P < 0.0001. g Immunofluorescence staining of human pancreatic ductal cells stimulated after 48 h stimulation with GSK126 or Taz. Cells were stained for DAPI, CK19, and INS. Images across three replicates of stimulation were captured at 20x magnification using ThermoFisher EVOS and processed with ImageJ. Scale bar represents 200 μm. Arrows point to CK19+INS+ cells. h Immunofluorescence staining of human pancreatic ductal cells stimulated after 48 h stimulation with GSK126 or Taz followed by 48 h drug free conditions (96 h). Cells were stained for DAPI, CK19, and INS. Images across three replicates of stimulation were captured at 20x magnification using ThermoFisher EVOS and processed with ImageJ. Scale bar represents 200 μm. Arrows point to CK19+INS+ cells. i Quantifiction of immunofluorescence staining of human pancreatic ductal cells stimulated after 48 h stimulation with GSK126 or Taz. Protein expression was quantified by normalizing the CK19+, INS+ and CK19+/INS+ signals relative to the nuclear DAPI signal. Insulin expressing cells were scored across a total of 1 × 10⁵ cells seeded on coverslips. Data are represented as mean ± S.E.M. of 6 replicates. Statistical significance was calculated by comparing control vs GSK126 or Taz using Student t-test, ****P < 0.0001. j Quantifiction of immunofluorescence staining of human pancreatic ductal cells stimulated after 48 h stimulation with GSK126 or Taz followed by 48 h drug free conditions (96 h). Protein expression was quantified by normalizing the CK19+, INS+ and CK19+/INS+ signals relative to the nuclear DAPI signal. Insulin expressing cells were scored across a total of 1 × 10⁵ cells seeded on coverslips. Data are represented as mean ± S.E.M. of 6 replicates. Statistical significance was calculated by comparing control vs GSK126 or Taz using Student t-test, ****P < 0.0001. k Glucose-stimulated insulin secretion assay assessed the regenerative capacity in human pancreatic ductal cells after 48-hour stimulation with GSK126 or Taz. Cells were exposed to low (2.8 mM) and high (28 mM) glucose conditions. Insulin secretion was quantified by ELISA. Fold changes in insulin release are shown for both glucose conditions. Data are of three replicate experiments represented as mean ± S.E.M of fold change relative to control. Statistical significance was calculated by comparing 2.8 mM vs 28 mM glucose using Student t-test, ****P < 0.0001. l Glucose-stimulated insulin secretion assay assessed the regenerative capacity in human pancreatic ductal cells after 48-hour stimulation with GSK126 or Taz followed by 48 h drug free conditions (96 h). Cells were exposed to low (2.8 mM) and high (28 mM) glucose conditions. Insulin secretion was quantified by ELISA. Fold changes in insulin release are shown for both glucose conditions. Data are of three replicate experiments represented as mean ± S.E.M of fold change relative to control. Statistical significance was calculated by comparing 2.8 mM vs 28 mM glucose using Student t-test, ****P < 0.0001

