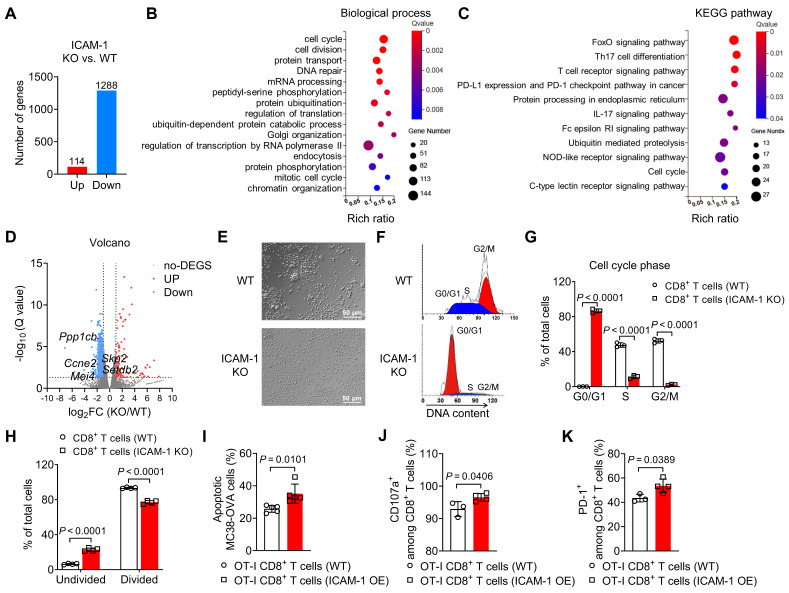
Figure 3.
ICAM-1 regulates the cell cycle, proliferation, and cytotoxicity of CD8+ T cells. (A-C) RNA sequencing gene expression profiling of splenic CD8+ T cells isolated from WT or ICAM-1 KO mice (n = 3 per group). (A) Number of significantly upregulated or downregulated genes between WT and ICAM-1 KO CD8+ T cells (fold change > 2; adjusted P < 0.05). Significantly enriched biological process (B) and Kyoto Encyclopedia of Genes and Genomes (KEGG) pathway (C) of downregulated genes in ICAM-1 KO versus WT CD8+ T cells. (D) Volcano plot depicting differentially expressed genes (ICAM-1 KO versus WT CD8+ T cells). Genes with Q-value < 0.05 and log2 (fold change) > 1 are highlighted. Red and blue dots represent upregulated and downregulated genes, respectively, in ICAM-1 KO CD8+ T cells. (E) Representative microscopic images of WT or ICAM-1 KO CD8+ T cells. (F, G) Representative flow cytometry histograms (F) and average frequencies of each cell cycle phase (G) among WT and ICAM-1 KO CD8+ T cells stimulated with precoated anti-CD3 and anti-CD28 antibodies for 24 h (n = 3 per group). (H) Average frequencies of dividing and non-dividing cells among WT or ICAM-1 KO CD8+ T cells determined by CFSE-labeled CD8+ T cells stimulated with precoated anti-CD3 and anti-CD28 antibodies for 3 days (n = 4 per group). (I-K) Proportion of apoptotic MC38-OVA cells (n = 5) (I), frequencies of CD107a+ cells among CD8+ T cells (n = 3-4) (J), and frequencies of PD-1+ cells among CD8+ T cells (n = 3-4) (K) after the incubation of WT OT-I T cells or ICAM-1 OE OT-I T cells with MC38-OVA cells at an effector-to-target (E : T) ratio of 1:1 for 24 h. Data are represented as mean ± SD. P values were determined using unpaired Student's t-test (G-K).

