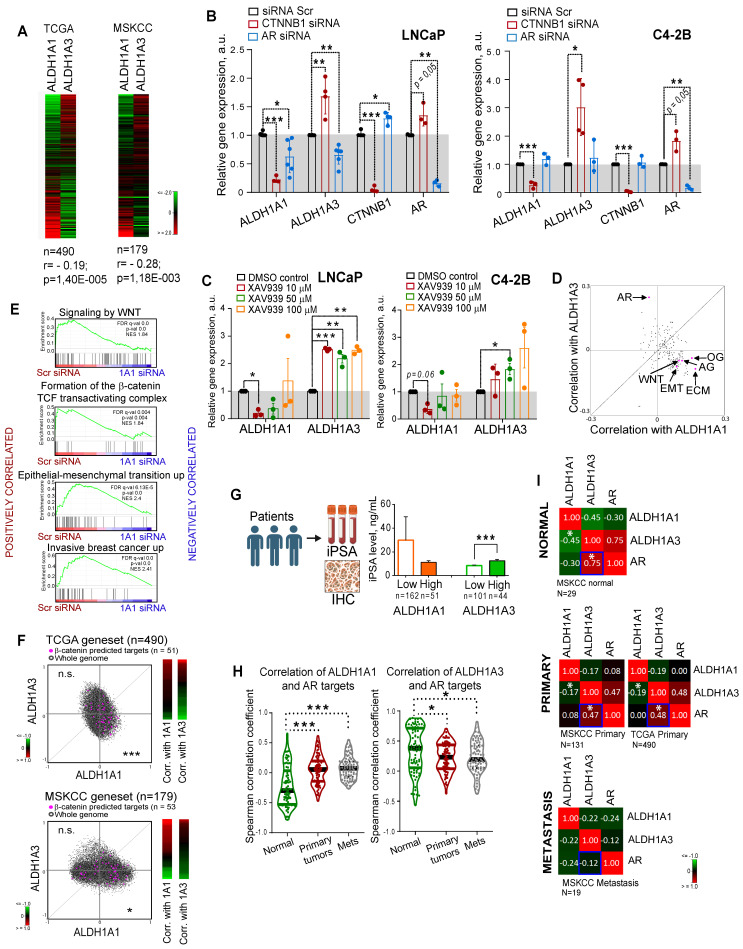
Figure 2.
Expression levels of ALDH1A1 and ALDH1A3 genes are mutually regulated. (A) Analysis of the TCGA dataset for patients with PCa (n = 490) and MSKCC cohort (n = 179, including normal tissue samples, n = 29; primary prostate cancer samples, n = 131; and metastatic prostate cancer samples, n = 19) showed a weak negative correlation of ALDH1A1 and ALDH1A3 genes. (B) Relative mRNA expression of ALDH1A1, ALDH1A3, CTNNB1, and AR upon the knockdown of CTNNB1 and AR genes. N ≥ 3; Error bars = SD. *p < 0.05; **p < 0.01; ***p < 0.001. (C) Analysis of ALDH1A1 and ALDH1A3 genes expression upon inhibition of WNT signaling pathway with XAV939 inhibitor. DMSO-treated cells were used as control. The cells were serum-starved in RPMI medium with 3% FBS for 24 h, followed by treatment with XAV939 at different concentrations. N = 3; Error bars = SEM. *p < 0.05; **p < 0.01; ***p < 0.001. (D) The correlation of the common molecular pathways with ALDH1A1 and ALDH1A3 in a provisional prostate cancer TCGA dataset (n = 490). AR: androgen receptor signaling targets; WNT: WNT signaling targets; ECM: extracellular matrix and adhesion molecules; EMT: epithelial to mesenchymal transition; AG: angiogenesis; OG: osteogenesis. n = 84 for all genesets; Gene lists are provided in Table S4. (E) GSEA analysis for genes significantly deregulated upon ALDH1A1 knockdown revealed their association with WNT/β-catenin inhibition, EMT and tumor invasion. (F) Correlation of mRNA expression for β-catenin predicted targets 27 with ALDH1A1 and ALDH1A3 in the TCGA and MSKCC patient cohorts. ***p < 0.001; *p < 0.05; n.s.- non-significant. (G) Correlation of the initial preoperative prostate-specific antigen (iPSA) serum level in patients with PCa with protein expression of ALDH1A1 and ALDH1A3 in tumor tissues (Lübeck cohort). Error bars = SEM. ***p < 0.001. (H) Correlation of ALDH1A1 and ALDH1A3 expression levels with the expression of the AR transcriptional targets in normal tissues (MSKCC dataset, n = 29), primary tumors (MSKCC dataset, n = 131), and metastatic tumors (MSKCC dataset, n = 19). The gene list for AR transcriptional targets is provided in Table S4. Statistical analysis was performed by Kruskal-Wallis rank sum test for multiple independent samples. Conover p-values were further adjusted by Benjamini-Hochberg FDR method; *p < 0.05; ***p < 0.001. (I) Correlation of ALDH1A1, ALDH1A3, and AR expression levels in normal tissues (MSKCC dataset, n = 29), primary tumors (MSKCC dataset, n = 131; TCGA dataset, n = 490), and metastatic tumors (MSKCC dataset, n = 19); *p < 0.05. Blue squares show the declining correlation of ALDH1A3 and AR expression from normal tissues through primary tumor to metastases.

