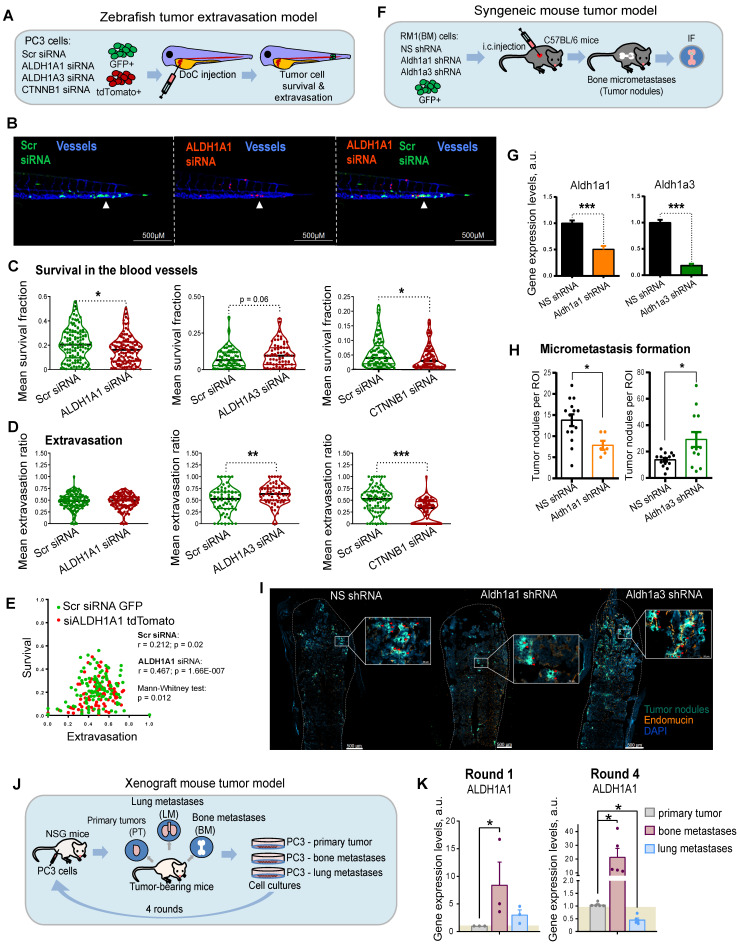
Figure 4.
ALDH genes differentially regulate experimental PCa metastases. (A) A scheme of the experiment performed in the zebrafish tumor extravasation model. (B) Representative fluorescent images of the zebrafish tail. CFP (blue) - vessels; tdTomato (red) - color-coded prostate cancer PC3 cells transfected with ALDH1A1 siRNA; GFP (green) - color-coded prostate cancer PC3 cells transfected with Scr siRNA. Arrows show extravasated cells. Scale bars = 500 µm. (C) Quantification of survival of PC3 cells upon ALDH1A1, ALDH1A3 and CTNNB1 knockdown. ALDH1A1 N = 118, ALDH1A3 N = 64, CTNNB1 N = 85. Fish that did not have survived cells of a particular color were excluded from survival analysis; *p < 0.05. (D) Quantification of the extravasation potential of color-coded PC3 cells upon ALDH1A1, ALDH1A3 and CTNNB1 knockdown; **p < 0.01; ***p < 0.001. (E) Correlation of in vivo cell survival and extravasation in response to the scrambled (Scr) siRNA transfection or siALDH1A1 transfection. Dissimilarity of cell survival and extravasation after Scr siRNA or ALDH1A1 siRNA transfection was evaluated by the data dimensionality reduction followed by the Mann-Whitney U test. (F) A scheme of the experiment for the syngeneic mouse tumor model. Three days after intracardiac injection of mouse prostate cancer RM1(BM) GFP+ cells with or without Aldh1a1 and Aldh1a3 depletion, the formation of tumor nodules was detected in the bones by immunofluorescence analysis. (G) Validation of knockdown efficacy in the mouse prostate cancer cell line RM1(BM) transfected with shRNA against Aldh1a1 and Aldh1a3. The data are plotted relative to the control non-specific shRNA (NS) sample. Error bars = SD; ***p < 0.001. (H) The number of tumor nodules formed in the bone tissue upon knockdown of Aldh1a1 or Aldh1a3 in the syngeneic immunocompetent mice was analyzed by immunofluorescence (N = 4 mice/group; N of analyzed bone slides: NS shRNA = 14, Aldh1a1 shRNA = 6, Aldh1a3 shRNA = 13; ROI (region of interest) = one bone slide). Outliers were removed by the iterative Grubbs' method with α = 0.05. Statistics were performed using a two-sided Mann-Whitney U test. Error bars = SEM; *p < 0.05. (I) Representative immunofluorescence images of the formed tumor nodules in the Aldh1a1 shRNA, Aldh1a3 shRNA, and control NS shRNA samples. Arrows show tumor nodules. Scale bars are 500 µm and 50 µM (inserts). (J) A scheme of the experiment for the xenograft mouse tumor model. After subcutaneous engraftment of human prostate cancer PC3 cells, primary tumors (PT), bone marrow (BM) and lung (LM) metastasis were formed. Small pieces of surgically excised tumors were cultured in vitro and gave rise to sublines PC3-PT (derived from the primary tumor), PC3-BM (derived from BM metastasis), and PC3-LM (derived from lung metastasis). (K) qPCR analysis of ALDH1A1 expression in the PC3 cells originating from different sites: primary tumors, bone marrow metastases, and lung metastases. Cells were passaged in mice in four rounds and the sublines from the 1st and 4th rounds were taken for the comparative analysis. The data is plotted relative to the primary tumor samples. N ≥ 3; Error bars = SEM. *p < 0.05.

