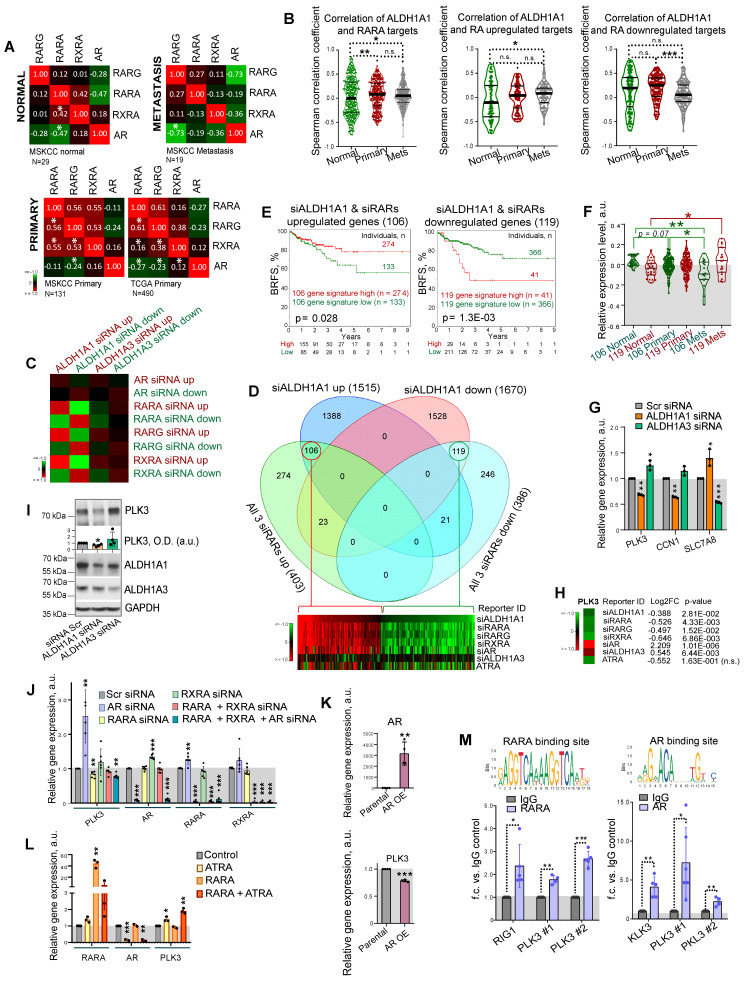
Figure 5.
ALDH genes differently regulate PLK3 in RAR- and AR-dependent manner. (A) Correlation of RARG, RARA, RXRA and AR expression levels in noncancerous tissues (MSKCC dataset, n = 29), primary tumors (MSKCC dataset, n = 131; TCGA dataset, n = 490), and metastatic tumors (MSKCC dataset, n = 19); *p < 0.05. (B) Correlation of ALDH1A1 expression levels with the expression of the previously described RARA transcriptional targets 48 and genes reported to be up- or downregulated in response to RA treatment 48 in normal tissues (MSKCC dataset, n = 29), primary tumors (MSKCC dataset, n = 131), and metastatic tumors (MSKCC dataset, n = 19). Statistical analysis was performed by the Kruskal-Wallis rank sum test for multiple independent samples. Conover p-values were further adjusted by the Benjamini-Hochberg FDR method; *p < 0.05; **p < 0.01; ***p < 0.001. (C) An enrichment score calculation relative to randomly expected revealed similar gene deregulation after the knockdown of ALDH1A1 and each individual retinoid receptor. No such trend was found for genes deregulated after ALDH1A3 knockdown. (D) Venn diagrams showing specific and common significantly deregulated genes in response to the knockdown of ALDH1A1 and all 3 retinoid receptors (RARA, RXRA, RARG). (E) The Kaplan-Meier analyses of biochemical recurrence-free survival of patients with high (red) compared to the low (green) expression level of gene signatures, including either 106 genes upregulated or 119 genes downregulated after knockdown of ALDH1A1 and all 3 retinoid receptors (TCGA dataset). (F) A relative expression of 119 geneset and 106 geneset in noncancerous tissues, n = 29; primary tumors, n = 131; and metastases, n = 19 in the MSKCC dataset. Relative expression of genesets was calculated as median of quantile normalized gene expression levels; *p < 0.05; **p < 0.01. (G) RT-qPCR analysis of PLK3, CCN1, and SLC7A8 expression in LNCaP cells upon ALDH1A1 and ALDH1A3 knockdown. N = 3; Error bars = SD; *p < 0.05; **p < 0.01; ***p < 0.001. (H) The data of RNAseq analysis for the PLK3 regulation in response to the knockdown of ALDH1A1, ALDH1A3, retinoid receptors, or treatment with 5x10⁻⁵M of ATRA. (I) Western blot analysis of PLK3 protein levels after knockdown of ALDH1A1 or ALDH1A3 expression. Representative images of one of four independent repeats are shown. Error bars = SEM; *p < 0.05. (J) RT-qPCR analysis of PLK3, AR, RARA and RXRA expression in LNCaP cells upon either knockdown of AR, RARA, RXRA, or RARA and RXRA together or knockdown of all three genes. N ≥ 3; Error bars = SD; **p < 0.01; ***p < 0.001. (K) RT-qPCR analysis of PLK3 and AR expression in PC3 cells stably overexpressing AR. N ≥ 3; Error bars = SEM; **p < 0.01; ***p < 0.001. (L) RT-qPCR analysis of PLK3, AR, and RARA expression in LNCaP cells upon transient RARA overexpression, treatment with 50 µM of ATRA for 48 h, or both. Cells transfected with empty plasmid were used as control. N = 3; Error bars = SD; *p < 0.05; **p < 0.01; ***p < 0.001. (M) The results of chromatin immunoprecipitation (ChIP)-qPCR analysis in LNCaP cells confirmed the direct binding of RARA and AR proteins to the multiple promoter regions of the target gene PLK3. Corresponding IgG was used as a negative control. RARA and AR binding sites were taken from the JASPAR CORE database 94. N ≥ 3; Error bars = SD; *p < 0.05; **p < 0.01; ***p < 0.001.

