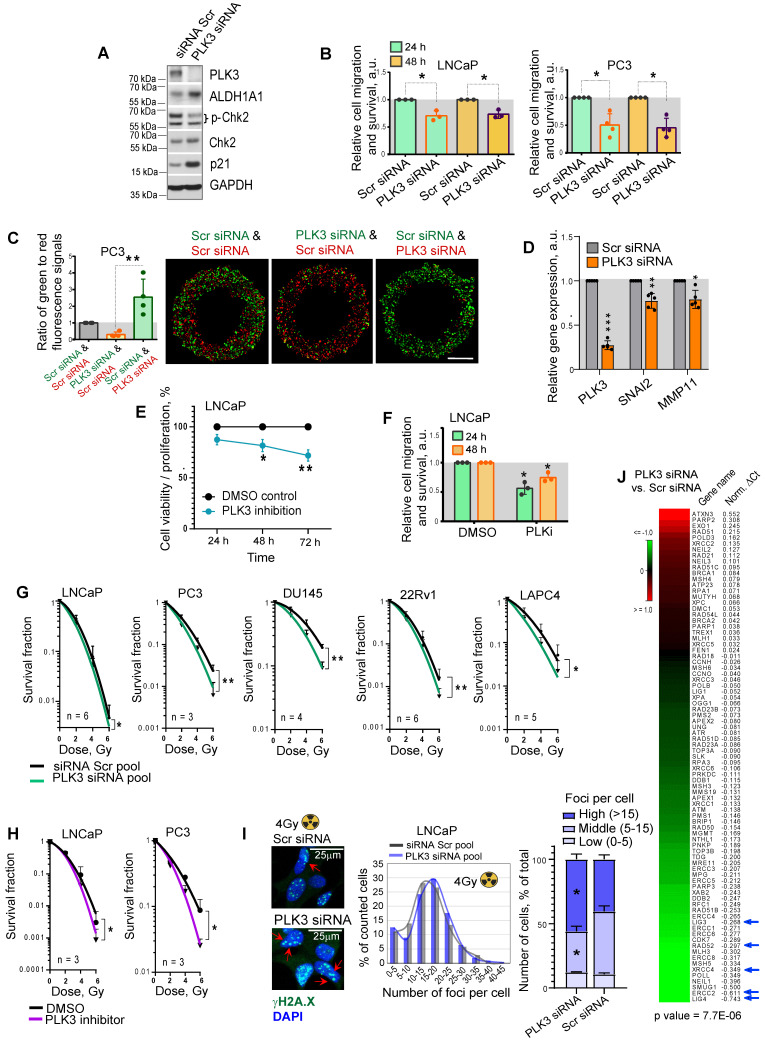
Figure 6.
PLK3 regulates PCa cell migration, proliferation and radioresistance. (A) Western blot analysis of PLK3, ALDH1A1, Chk2, p-Chk2 (T68) and p21 expression after PLK3 knockdown; representative images of one of two independent repeats are shown. (B) Analysis of the relative cell migration and survival of LNCaP and PC3 cells upon PLK3 knockdown by using Oris migration assay. Cells transfected with Scr siRNA were used as a control. Cell invasion was analyzed 24 h and 48 h after cell plating. N ≥ 3; Error bars = SD; *p < 0.05. (C) Analysis of the relative cell migration and survival of PC3 cells stably expressing GFP or tdTomato after PLK3 knockdown by Oris migration assay. Cells transfected with Scr siRNA were used as a control. The intensity ratio of the green and red fluorescence was calculated within the invaded area 48 h after cell plating; Scale bars = 500 µm. N ≥ 3; Error bars = SD; **p < 0.01. (D) RT-qPCR analysis of SNAI2 and MMP11 expression in LNCaP cells in response to PLK3 knockdown. Cells transfected with Scr siRNA were used as a control; N ≥ 3; Error bars = SD; *p < 0.05; **p < 0.01; ***p < 0.001. (E) The CellTiter-Glo viability and proliferation analysis of LNCaP cells in response to the treatment with PLK3 inhibitor GW843682X at IC50 concentration of 1.73 x 10⁻⁷ M. N = 3; Error bars = SD; *p < 0.05; **p < 0.01. (F) Analysis of the relative cell migration and survival of LNCaP cells after 24 h pre-treatment with PLK3 inhibitor GW843682X at IC50 concentration of 1.73 x 10⁻⁷ M using Oris migration assay. Cells treated with DMSO were used as a control. Cell invasion was analyzed 24 h and 48 h after cell plating. N = 3; *p < 0.05. (G) Relative cell radiosensitivity was analyzed by 2D radiobiological colony forming assay after siRNA-mediated knockdown of PLK3 in LNCaP, PC3, DU145, 22Rv1 and LAPC4 cells. Cells transfected with scrambled (Scr) siRNA were used as control. N ≥ 3; Error bars = SD; *p < 0.05; **p < 0.01. (H) Cell radiosensitivity was analyzed after 24 h pre-treatment with PLK3 inhibitor GW843682X at IC50 concentrations in LNCaP cells (IC50 = 1.73 x 10⁻⁷ M), and PC3 cells (IC50 = 4.34 x 10⁻⁷ M). Cells treated with DMSO were used as control. N ≥ 3; Error bars = SD; *p < 0.05; **p < 0.01. (I) The knockdown of the PLK3 gene resulted in more severe DNA damage in LNCaP cells after irradiation. DNA double-stranded breaks (DSBs) were analyzed by γ-H2A.X foci analysis in the individual cells 24 h after 4 Gy of X-ray irradiation. Arrows show the exemplary γ-H2A.X foci; the graphs show a distribution of cell nuclei by foci number after 4Gy of X-ray irradiation. Scale bars = 25 µm; *p < 0.05. (J) PLK3 inhibition lowered the expression of crucial DNA damage response regulators. LNCaP cells transfected either with scrambled (Scr) siRNA or with PLK3 siRNA were analyzed by RT2 DNA Repair profiler qPCR assay.

