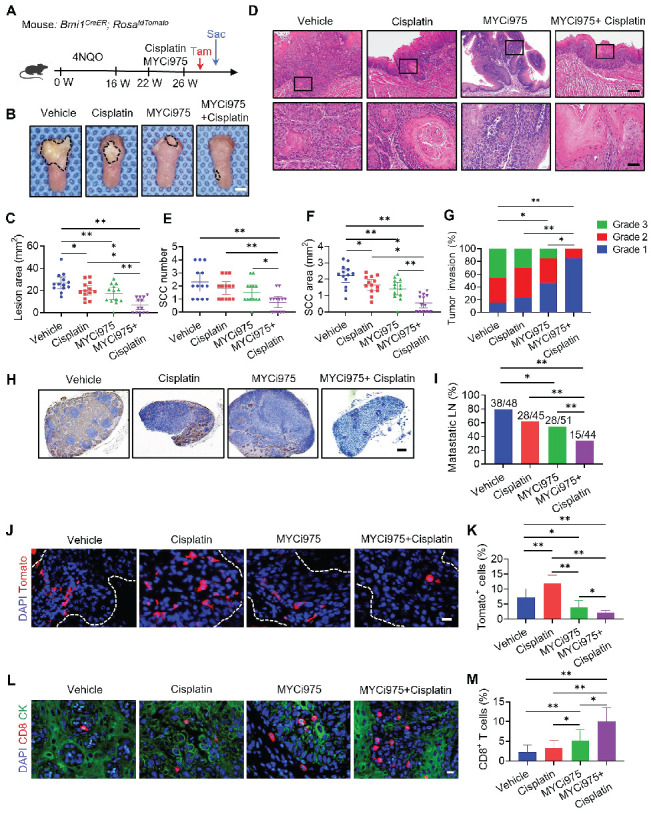
Figure 5.

MYCi975 plus cisplatin eliminates CSCs in vivo, potently inhibits HNSCC. (A) Schematic diagrams showing the treatment and lineage tracing of primary HNSCC in Bmi1CreER; RosatdTomato mice. Tamoxifen (Tam) was administered 1 day before sacrificing (Sac) the mice to label BMI1+ CSCs. (B) Representative image of tongue visible lesions in the different treatment groups. Black dashed lines denote the lesion areas. Scale bar, 2 mm. (C) Quantification of the HNSCC lesion area from mice treated as indicated. The values are means ± SDs from the pool of two independent experiments. n = 13. (D) Representative H&E staining of HNSCC from mice treated as indicated. Scale bar, 200 μm. Enlarged images are shown in the lower panels. Scale bar, 40 μm. (E-F) Quantification of HNSCC tumor number and area from mice treated as indicated. The values are means ± SDs from the pool of two independent experiments. n = 13. *P < 0.05 and **P < 0.01 using one-way ANOVA. (G) Quantification of HNSCC invasion grades from mice treated as indicated. The data were pooled from two independent experiments. n = 13. *P < 0.05 and **P < 0.01 using the Cochran-Armitage test. (H) Immunostaining of metastatic cells in cervical lymph nodes using anti-PCK antibodies. Scale bar, 200 μm. (I) Percentage of metastatic lymph nodes from mice treated as indicated. The number of metastatic lymph nodes in each group is indicated in the figure. Data were pooled from two independent experiments. *P < 0.05 and **P < 0.01 using a χ2 test. (J) Representative images of Tomato+ BMI1+ CSCs in HNSCC from mice treated as indicated. The white dashed lines denote the tumor-stromal junction. Scale bar, 20 μm. (K) Quantification of the percentage of Tomato+ cells in HNSCC from mice treated as indicated. The values are means ± SDs from the pool of two independent experiments. n = 13. *P < 0.05 and **P < 0.01 using one-way ANOVA. (L) Immunostaining images for CD8+ T cells from mice treated as indicated. Scale bar, 10 μm. (M) Quantification of CD8+ T cells in HNSCC from mice treated as indicated. The values are means ± SDs from the pool of two independent experiments. n = 13. *P < 0.05 and **P < 0.01 using one-way ANOVA.
