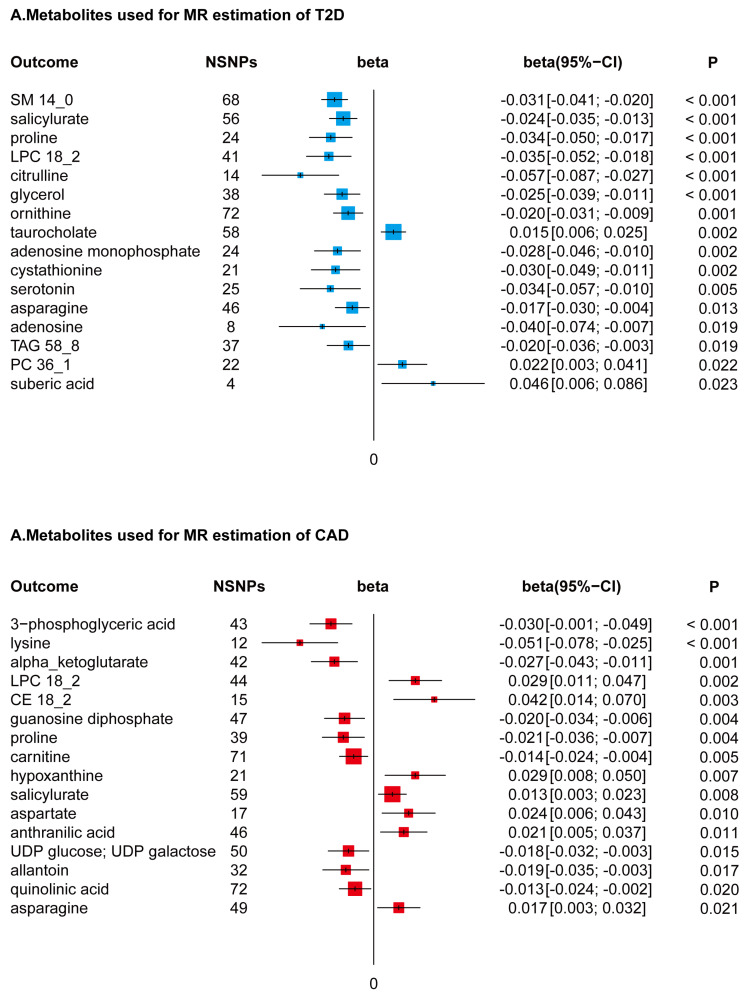
Figure 3.
Forest Plots of MR-Derived Causal Estimates. Displayed here are the results from inverse variance-weighted MR analyses, examining the causal effects of different metabolites on T2D and CAD. Beta coefficients, along with 95% confidence intervals (CI), are shown, illustrating the variation in disease risk associated with each 10-unit increase in metabolite concentration. Analyzed metabolites include sphingomyelin (SM), lysophosphatidylcholine (LPC), triacylglycerol (TAG), phosphatidylcholine (PC), and cholesterol ester (CE).

