Figure 2.

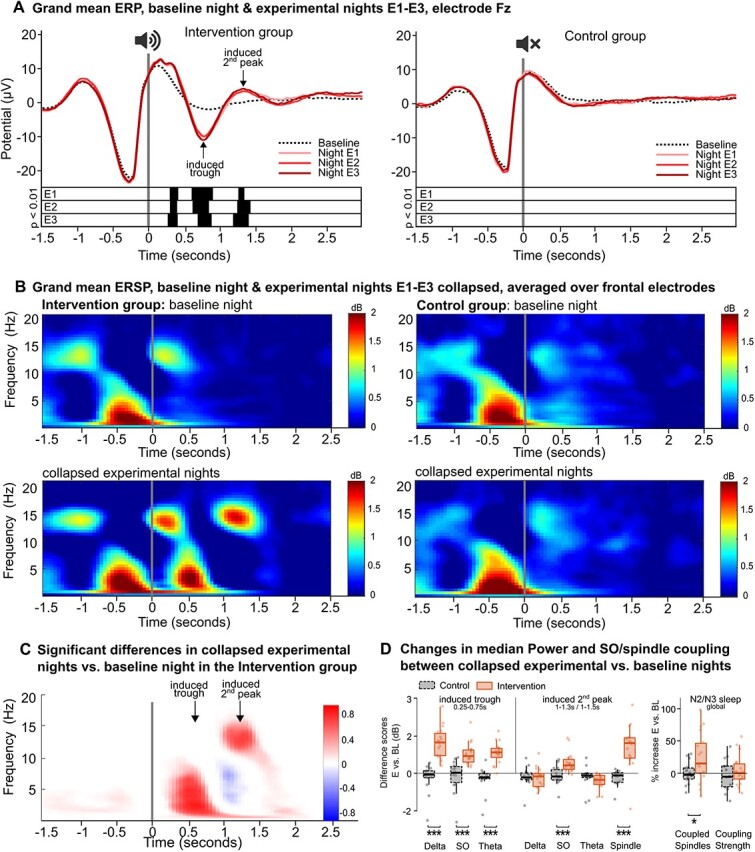
Physiological changes in (EEG) brain activity time locked to the stimulation. (A) Grand mean ERPs (channel Fz). Left: The intervention group’s ERPs in the three experimental nights (red lines) differed from the baseline night’s ERP (black dotted line). Significant differences corrected for multiple comparisons are displayed by black bars below the ERPs. Right: there are no differences in the control group. (B) Grand mean ERSPs over frontal channels. Sham-PLAS (top row and bottom right) is represented by high activity in the SO and spindle bands within the first second of the sham stimulation. Bottom left: In the intervention group stimulation induced additional power in the delta (1–4 Hz), theta (4–8 Hz) and spindle (12–16) band corresponding to the entrained trough and peak. (C) Significant clusters showing differences between the baseline and the collapsed experimental nights in the intervention group. Clusters in red show increased power and clusters in blue show decreased power. The colour gradient represents the proportion of involved electrodes, where 1 = 128 electrodes, positive effect (E > BL), and −1 = 128 electrodes, negative effect (BL > E). In the induced trough, SO, delta and theta power were significantly increased. In the induced second peak, spindle and SO power were increased, while delta and theta power were decreased. (D) Left: Difference scores (experimental nights—BL night) for extracted median power values in temporospatial-frequency clusters of interest for the intervention (red solid bars) and the control group (black dashed bars). The frequency bins are displayed on the x-axis. The time-windows were indicated by Figure 2C: trough: 0.25–0.75, induced peak: 1–1.3 (1–1.5 for spindles). Right: Group differences in PLAS-induced SO/spindle coupling parameters during N2/N3 sleep for the intervention (red solid bars) and control group (black dashed bars). Relative averaged increases in the experimental nights compared to the baseline night are depicted for the number of SO-coupled spindles (left) and SO/spindle coupling strength (right). Note:***P < 0.001, *P < 0.05.
