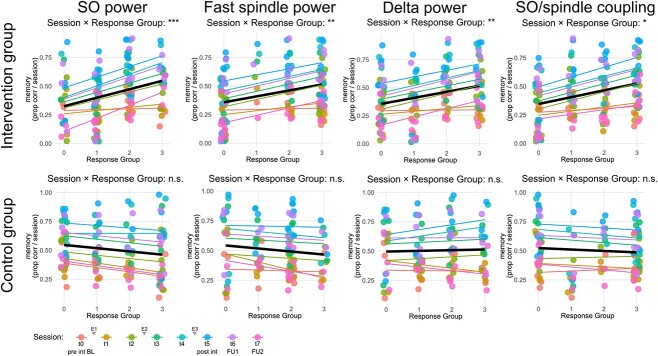
Figure 4.
Dose–response effect. Repeated responsiveness across multiple stimulation nights based on four physiological responsiveness measures (SO power, spindle power, delta power and SO/spindle coupling). Based on a median split for each night’s responsiveness in each measure, participants were allocated to a ‘higher responsiveness’ group (above median) or a ‘lower responsiveness’ group (at or below median). The x-axis displays the number of nights a participant was allocated to the ‘higher responsiveness’ group, zero indicating never and three indicating for all experimental nights. The y-axis shows the memory score as a proportion of correct responses per session. Different colours represent different sessions during which memory was assessed. Linear best-fit regression lines of data points are displayed as a mean over all sessions (black line) as well as colour coded for the individual sessions. Significant interactions (likelihood-ratio χ2-tests) between session and Response Group exclusively in the intervention group indicates that repeated responsiveness drives memory gains in the intervention group but not the control group. Note: Session t0 = pre-intervention (evening before first experimental night), Session t1 = morning after first experimental night, Session t2 = evening before second experimental night, [. . .], Session t5 = post intervention (morning after last experimental night), Session t6 = 1-week follow-up, Session t7 = 3-month follow-up, pre int BL = pre-intervention (baseline), E1 = experimental night 1, E2 = experimental night 2, E3 = experimental night 3, post int = post-intervention, FU1 = 1-week follow-up, FU2 = 3-month follow-up, *P < 0.05, **P < 0.01, ***P < 0.001.

