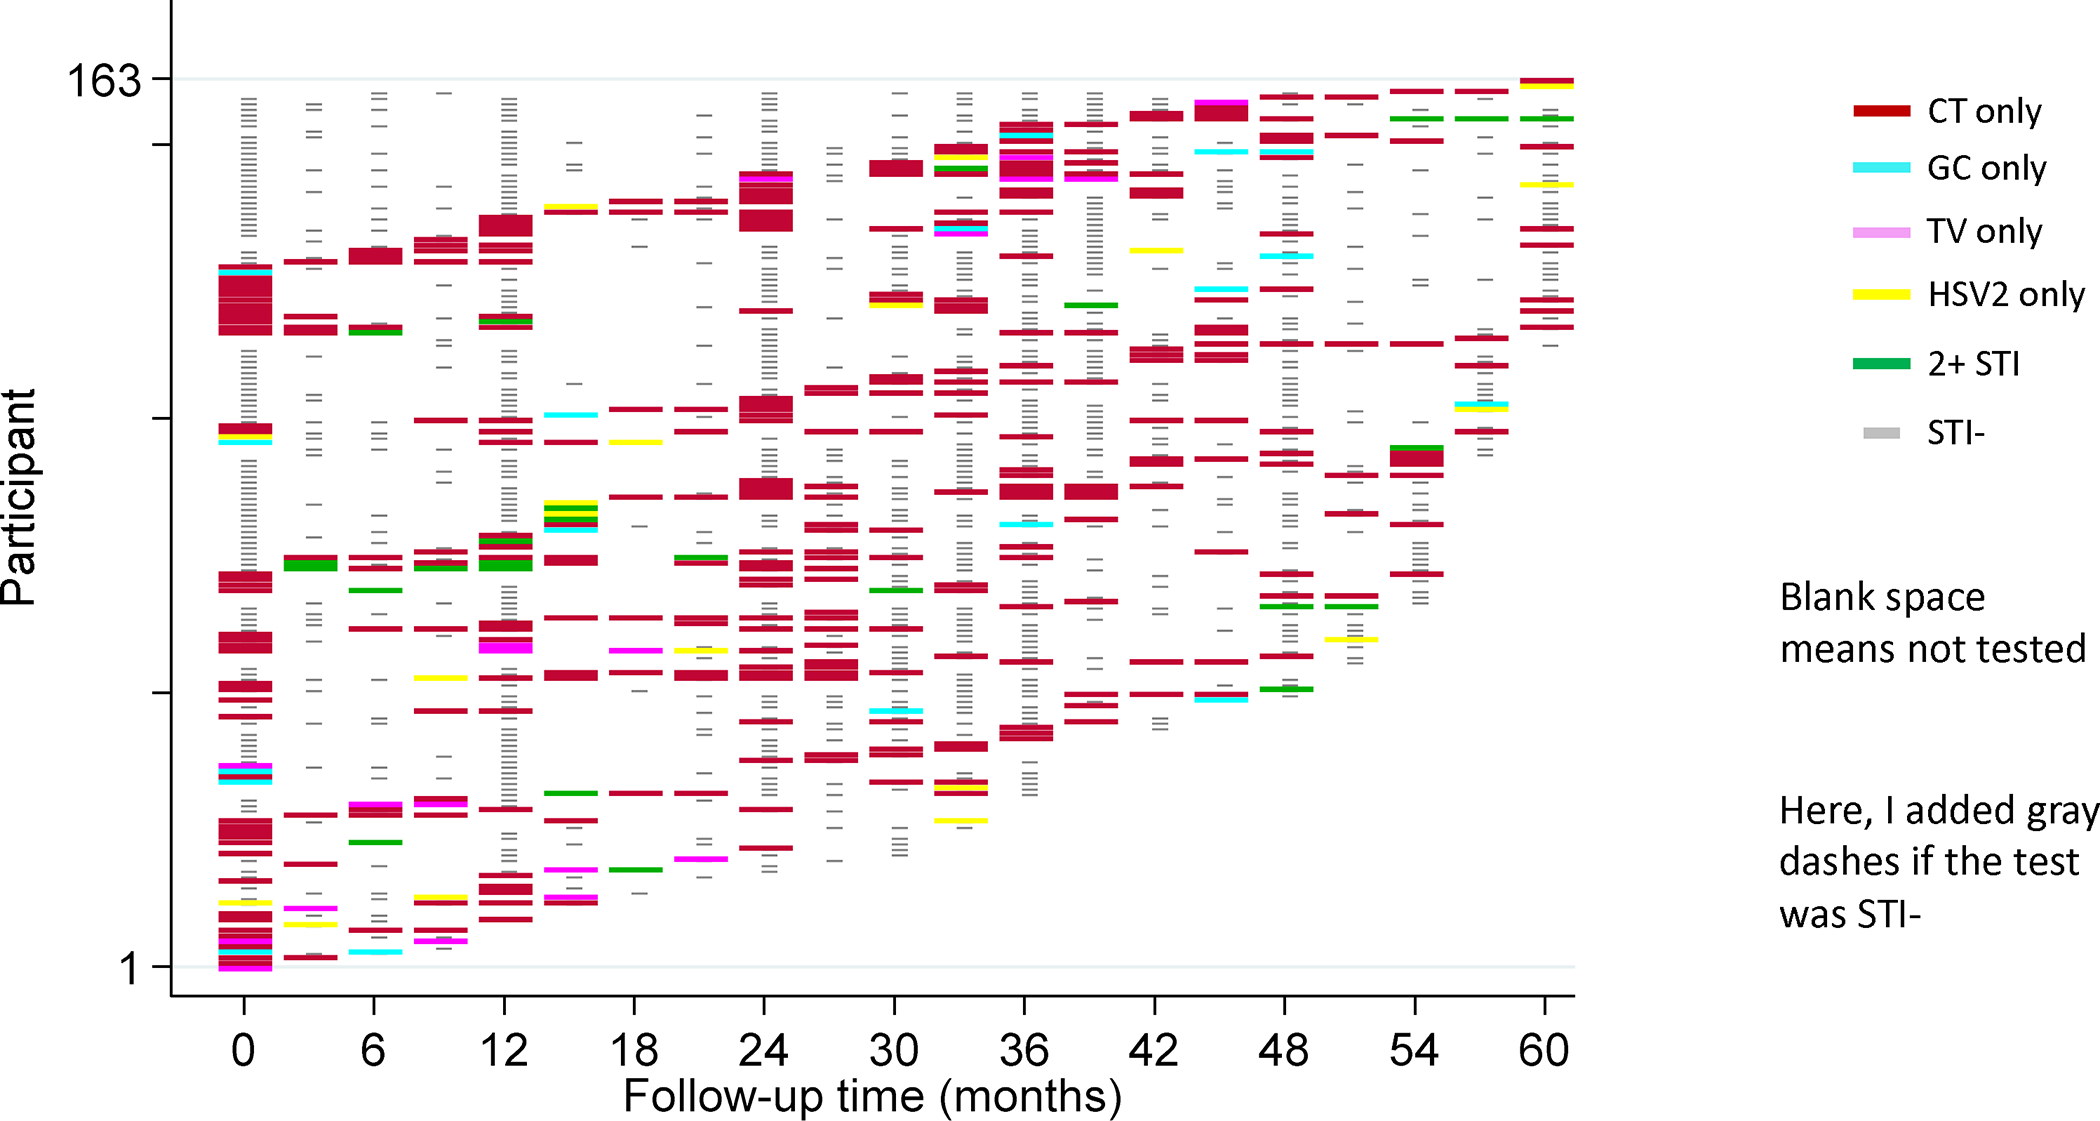
Figure 3. Visualization of STI events over 60 months of follow-up for those diagnosed with STI (N=163).

Each participant is represented by one row. Each participant’s STI history can be tracked longitudinally across the heatmap, with color key corresponding to STI test results at each timepoint on the X axis. Study visits with negative test results are denoted by light gray color. Timepoints with no testing are denoted by a blank space.
