Figure 1.
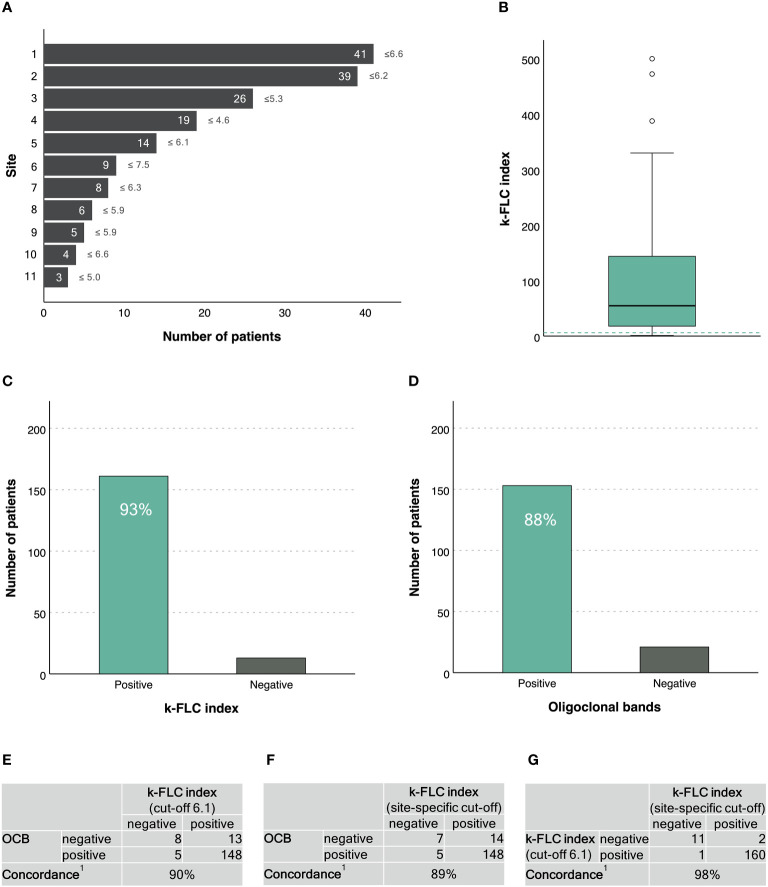
κ-FLC index in patients with primary progressive MS. (A) Number of patients (and κ-FLC index cut-off points) provided per MS centre2. (B) Distribution of κ-FLC index3. (C) Prevalence of positive/negative κ-FLC index (using a cut-off of 6.1). (D) Prevalence of positive/negative OCB. (E) Agreement between κ-FLC index (using a cut-off of 6.1) and OCB. (F) Agreement between κ-FLC index (using the centre-specific cut-offs) and OCB. (G) Agreement between κ-FLC index using a cut-off of 6.1 or centre-specific cut-offs. 1 Concordance was calculated as the number of positives revealed by both methods and the number of negatives revealed by both methods, related to the total number of patients, and expressed as percentage. 2 Patients’ data were drawn out of following publications and/or recruited through following MS centres: 1 Leurs et al. Mult Scler 2020;26(8):912-923. 2 Cavalla et al. J Neuroimmunol 2020;339:577122 (n=11) and unpublished data of patients from AOU Città della Salute e della Scienza di Torino, Torino, Italy (n=28). 3 Emersic et al. Clin Chim Acta 2019;489:109-116 (n=8) and unpublished data of patients from University Medical Centre Ljubljana, Ljubljana, Slovenia (n=18). 4 Rosenstein et al. J Neurochem 2021;159(3):618-628. 5 Unpublished data of patients from Medical University of Innsbruck, Innsbruck, Austria. 6 Christiansen et al. Clin Chem Lab Med 2018;57(2):210-220. 7 Bayart et al. Acta Neurol Scand 2018;138(4):352-358. 8 Presslauer et al. Mult Scler 2016;22(4):502-10. 9 Presslauer et al. J Neurol 2008;255(10):1508-14. 10 Gaetani et al. J Neuroimmunol 2020;339:577108. 11 Vecchio et al. Sci Rep 2020;10(1):20329. 3 The horizontal, green, dashed line indicates a κ-FLC index at 6.1. FLC, free light chain; OCB, oligoclonal bands.

