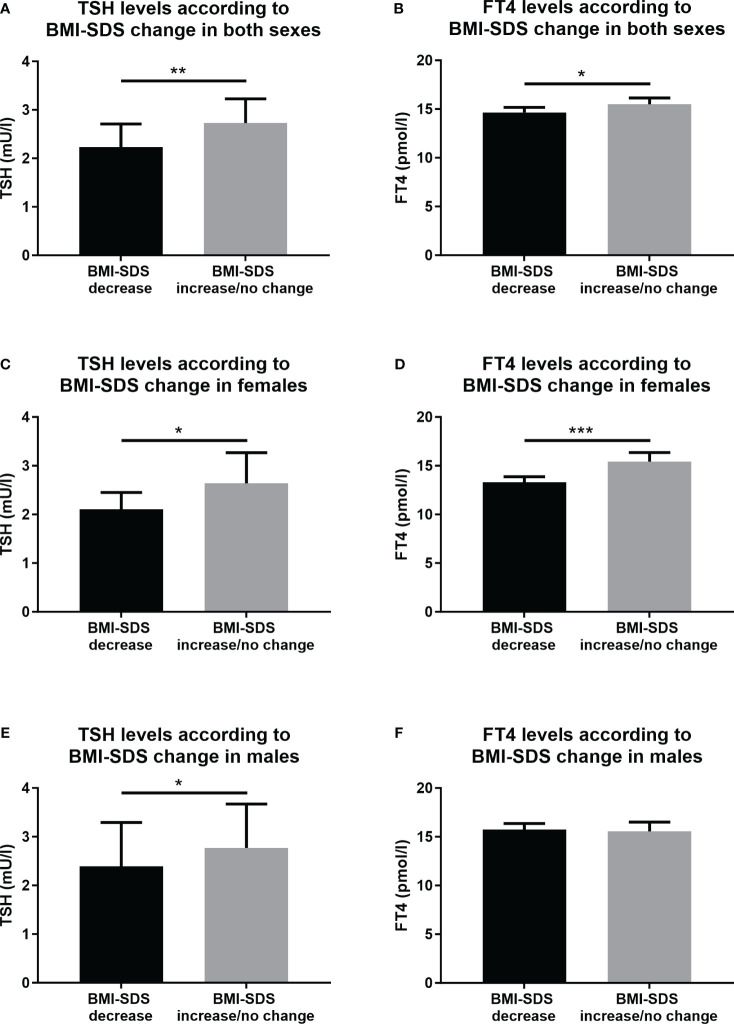
Figure 1.
Serum levels of TSH and FT4 in the subgroups of adolescents with obesity according to the BMI-SDS change. (A) TSH levels in both sexes, (B) FT4 levels in both sexes, (C) TSH levels in females, (D) FT4 levels in females, (E) TSH levels in males, and (F) FT4 levels in males. BMI, body mass index; SDS, standard deviation score; TSH, Thyroid-stimulating hormone; FT4, free thyroxine. Included to this analysis were participants from the group of adolescents with obesity. Data for FT4 levels are displayed as mean and 95% confidential intervals for the mean. Data for TSH levels are displayed as median and 95% confidential intervals for the median. Differences were calculated with t-test. TSH data were prior T-test analyses logarithmically transformed. Significant differences were marked with *(p<0.005), **(p<0.01), and ***(p<0.001).

