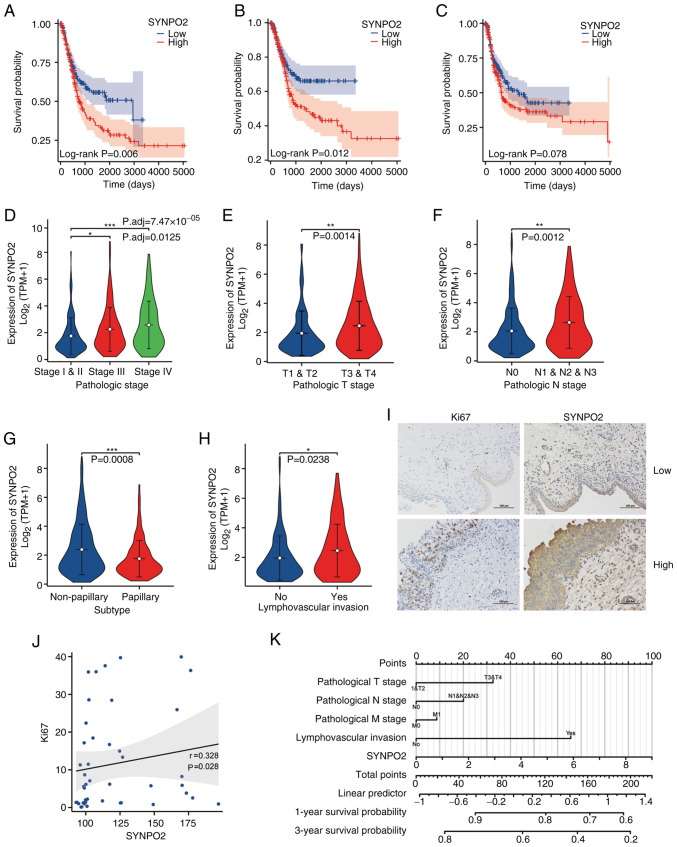
Figure 1.
High SYNPO2 expression is a poor prognostic factor in BLCA. (A) Overall survival in patients with BLCA with low (n=206) and high (n=205) SYNPO2 expression. (B) Disease-specific survival in patients with BLCA in low (n=200) and high (n=179) SYNPO2 expression groups. (C) Progression-free interval for patients based on SYNPO2 expression (low, n=206; high, n=206). (D) Distribution of SYNPO2 expression in BLCA samples from patients at different stages. Stage I and stage II (n=133), stage III (n=142), stage IV (n=135). Stage I and II vs. stage III, P.adj=0.0125, stage I and II vs, stage IV P.adj=7.47×1005. (E) Distribution of SYNPO2 expression in patients with BLCA at different T stages. T1 and T2 (n=123) vs. T3 and T4 (n=255), P=0.0014. (F) SYNPO2 expression in patients with BLCA at different N stages. N0 (n=238) vs. N1, N2 and N3 (n=130), P=0.0012. (G) SYNPO2 expression in BLCA samples of non-papillary (n=273) and papillary (n=134) subtypes. P=0.0008. (H) SYNPO2 expression in patients with BLCA with (n=129) or without (n=152) lymphovascular invasion. P=0.0238. (I) Representative immunohistochemistry of Ki67 and SYNPO2 staining in BLCA tissue with low and high SYNPO2 expression. (J) Spearman correlation analysis of Ki67 and SYNPO2 expression (n=45). (K) Nomogram based on multivariate Cox regression analysis for 1 and 3-year survival probability. SYNPO2, synaptopodin-2; BLCA, Bladder Urothelial Carcinoma; TPM, Transcript per million. *, ** and *** indicate P<0.05, P<0. 01, P<0.001, respectively.

