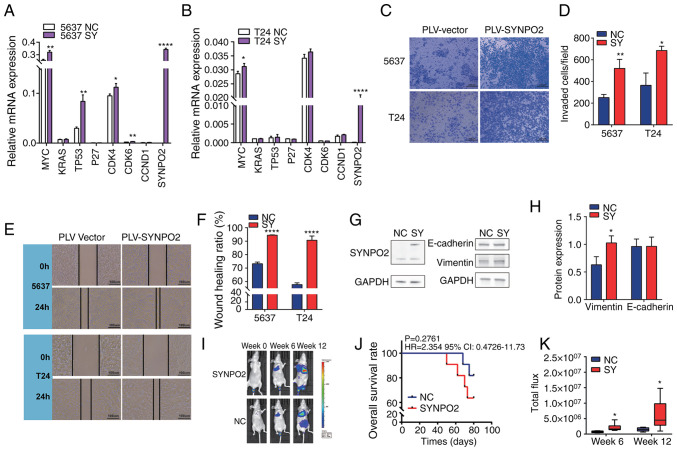
Figure 2.
SYNPO2 overexpression increases invasion of BLCA in vivo and in vitro. (A) mRNA levels in NC and SYNPO2-overexpressing 5637 cells was detected by reverse transcription-quantitative PCR. MYC, P=0.0019; TP53, P=0.0023; CDK4, P=0.0221; CDK6, P=0.0022 and SYNPO2, P<0.0001 between NC and SY group. (B) mRNA levels in T24 cells. MYC, P=0.0343 and SYNPO2, P<0.0001 between NC and SY group. (C) Transwell invasion assay of BLCA cell lines with SYNPO2 overexpression. (D) Number of invaded 5637 (P=0.006) and T24 cells (P=0.0101). (E) Representative (F) wound healing assay in 5637 or T24 cells at 0 and 24 h. (G) Western blotting analysis for (H) SYNPO2, E-cadherin, vimentin and GAPDH protein. Vimentin, P=0.025. (I) Bioluminescence imaging of 5637-Luc cells at 0, 6 and 12 weeks. (J) Kaplan-Meier survival analysis of nude mice implanted with 5637-Luc cells. (K) Total flux in each group in vivo imaging. 6 week NC (n=6) vs. SY (n=6), P=0.0247; 12 week NC (n=6) vs. SY (n=5), P=0.0445. SYNPO2, Synaptopodin-2; BLCA, Bladder Urothelial Carcinoma; NC, Negative Control; SY, SYNPO2 overexpression; Luc, Luciferase. *, ** and **** indicate P<0.05, P<0.01, P<0.0001, respectively.

