Figure 5.
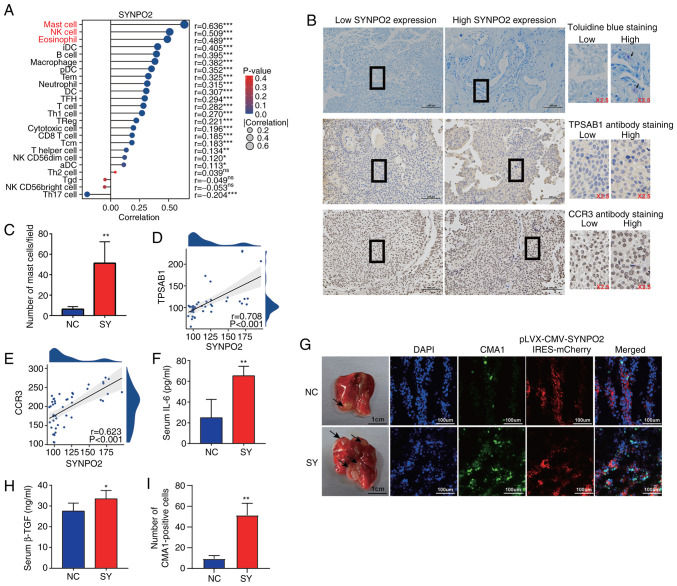
SYNPO2 expression enhances mast cell infiltration. (A) SYNPO2 expression in 24 types of immune cell. Red text indicates a high correlation. (B) Representative toluidine and immunohistochemical staining in clinical Bladder Urothelial Carcinoma (BLCA) samples with low and high SYNPO2 expression. Purple represents cell degranulation. Scale bar, 100 µm. (C) Mast cell number/field in low and high SYNPO2 expression groups (P=0.0053). Correlation between SYNPO2 and (D) TPSAB1 and (E) CCR3 expression based on H-score. (F) Mouse serum IL-6 levels in NC (n=5) and SY (n=5; P=0.002). (G) Representative indirect immunofluorescence of a frozen lung section from a mouse model with pulmonary metastasis. The black arrow indicates the area of tumor invasion in the lung tissue. (H) Mouse serum TGF-β1 levels (P=0.045). (I) CMA-positive cells (n=3, P=0.0036). SYNPO2, synaptopodin-2; TPSAB1, Tryptase alpha/beta-1; CCR3, C-C chemokine receptor type 3; NC, Negative Control; SY, SYNPO2 overexpression; CMA1, Chymase 1. * and ** indicate P<0.05, P<0.01, respectively.

