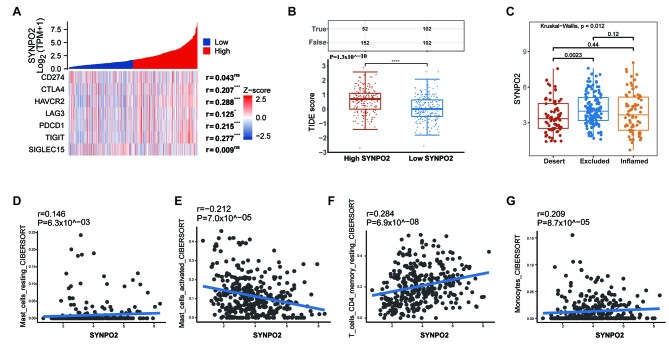
Figure 6.
High SYNPO2 expression increases resistance to anti-PDL1 immune therapy. (A) Correlation of immune checkpoint genes with SYNPO2. (B) TIDE score. True presents numbers of positive immune responses; False presents numbers of negative immune responses; Red, resistance to immune checkpoint blocking; blue, positive response, P=P=1.3×10^−10. (C) Differences in SYNPO2 expression in three immune infiltration types, The Deserted VS The Excluded P=0.0023. Correlation between SYNPO2 and (D) resting, P=6.3×10^−03 and (E) activated mast cell, P=7.0×10^−05, (F) resting CD4 memory T and (G) monocyte infiltration in the IMVigor 210 cohort (n=348). SYNPO2, Synaptopodin-2; TPM, Transcript per million; PDL1, Programmed cell death 1 ligand 1; TIDE, Tumor Immune Dysfunction and Exclusion; ns, no significance. *, *** and **** indicate P<0.05, P<0.001, P<0.0001, respectively.

