. 2023 Oct 6;84(1):17–25. doi: 10.1158/0008-5472.CAN-23-0650

Figure 3.

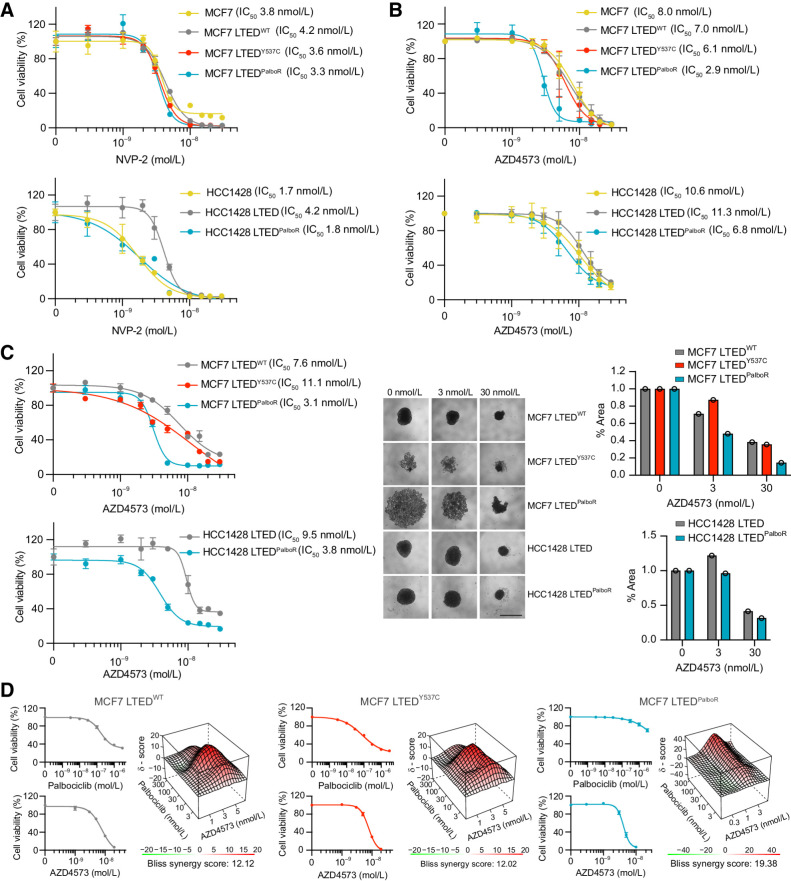
Figure 3. CDK9 inhibitors impair cell viability in 2D and 3D culture. A and B, A total of 4,000 to 8,000 cells were seeded in 96-well tissue culture plates and treated at day 1 and 3 with the CDK9 inhibitors NVP-2 (A) or AZD4573 (B) at the indicated concentrations. Cell viability was assessed using CellTiter-Glo (day 7). Mean values ± SEM. Data represent percentage NVP-2/AZD4573–treated viable cells compared with vehicle control. n = 4 technical replicates; n = 1 biological replicate. C, A total of 2,500 cells were seeded in 96-well ultra-low attachment round-bottomed plates. The resulting spheroids were treated with AZD4573 at days 3 and 6. Cell viability was assessed on day 10 (endpoint). Graphs showing percentage of viable AZD4573-treated cells compared with vehicle control. n = 1 biological replicate; n = 4 technical replicates. Mean values ± SEM. Representative images and quantification of spheroid area at endpoint following treatment with 0 nmol/L, 3 nmol/L, or 30 nmol/L AZD4573 are shown. Scale bar, 1 mm. D, A total of 3,000 to 5,000 MCF7 LTEDWT, LTEDY537C, or LTEDPalboR cells were seeded in 2D 96-well tissue culture plates and treated with escalating doses of palbociclib and AZD4573 at day 1 and 3. Cell viability was assessed using CellTiter-Glo on day 7. Data representing percentage of viable cells compared with vehicle control. n = 1 biological replicate; n = 3 technical replicates; mean values ± SEM. Top, individual drug responses. Bottom, synergy plots. The Bliss synergy score references the most synergistic area of the plot.

CDK9 inhibitors impair cell viability in 2D and 3D culture. A and B, A total of 4,000 to 8,000 cells were seeded in 96-well tissue culture plates and treated at day 1 and 3 with the CDK9 inhibitors NVP-2 (A) or AZD4573 (B) at the indicated concentrations. Cell viability was assessed using CellTiter-Glo (day 7). Mean values ± SEM. Data represent percentage NVP-2/AZD4573–treated viable cells compared with vehicle control. n = 4 technical replicates; n = 1 biological replicate. C, A total of 2,500 cells were seeded in 96-well ultra-low attachment round-bottomed plates. The resulting spheroids were treated with AZD4573 at days 3 and 6. Cell viability was assessed on day 10 (endpoint). Graphs showing percentage of viable AZD4573-treated cells compared with vehicle control. n = 1 biological replicate; n = 4 technical replicates. Mean values ± SEM. Representative images and quantification of spheroid area at endpoint following treatment with 0 nmol/L, 3 nmol/L, or 30 nmol/L AZD4573 are shown. Scale bar, 1 mm. D, A total of 3,000 to 5,000 MCF7 LTEDWT, LTEDY537C, or LTEDPalboR cells were seeded in 2D 96-well tissue culture plates and treated with escalating doses of palbociclib and AZD4573 at day 1 and 3. Cell viability was assessed using CellTiter-Glo on day 7. Data representing percentage of viable cells compared with vehicle control. n = 1 biological replicate; n = 3 technical replicates; mean values ± SEM. Top, individual drug responses. Bottom, synergy plots. The Bliss synergy score references the most synergistic area of the plot.