. 2023 Oct 6;84(1):17–25. doi: 10.1158/0008-5472.CAN-23-0650

Figure 4.

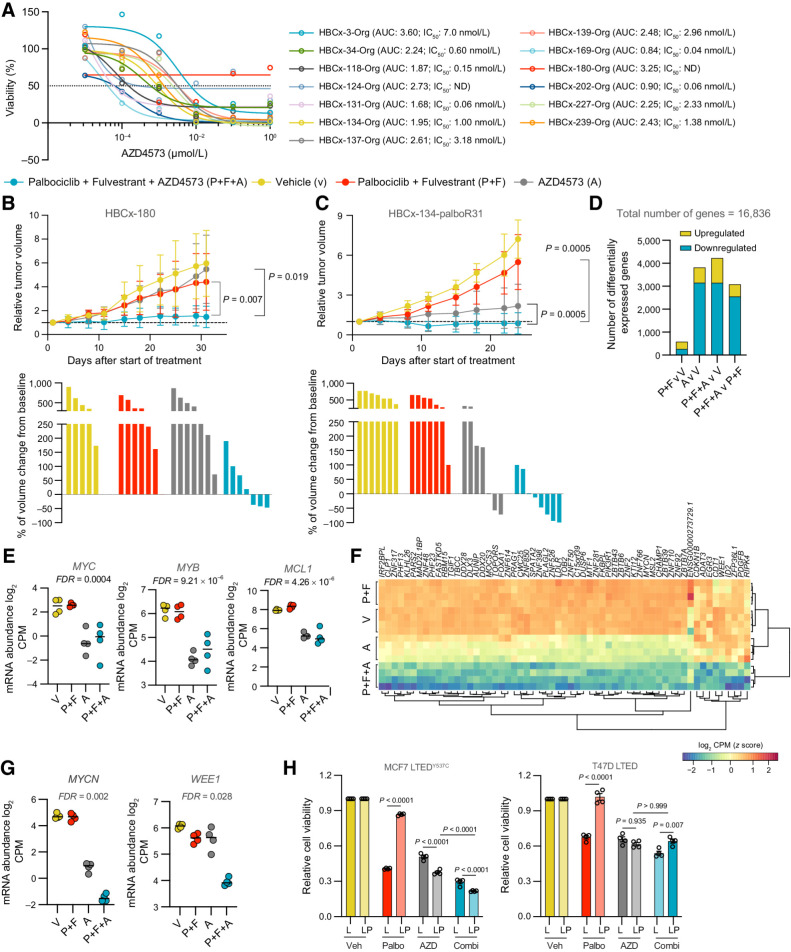
Figure 4. CDK9 inhibitor AZD4573 drives tumor regression in endocrine therapy and palbociclib-resistant PDXs. A, 2–5 × 10⁴ dissociated PDO cells were seeded per well in 96-well tissue culture plates in 10% Matrigel. The resulting organoids were treated with escalating doses of AZD4573 at day 2. Cell viability was assessed on day 7. Dose–response curves showing percentage of viable AZD4573-treated cells compared with vehicle control. n = 4 wells per PDO. Drug response represented by sigmoidal dose–response curve. IC50 and AUC (area under curve) values are shown. ND, not determined. B and C, HBCx-180 (B) and HBCx-134-palboR31 (C) PDXs were inoculated into 8-week-old Swiss nude mice. Xenografts were randomly assigned to different groups when tumors reached a volume of 100 to 200 mm3 and treated with vehicle, palbociclib + fulvestrant, AZD4573 or the combination of palbociclib + fulvestrant + AZD4573 (V, P+F, A, P+F+A). Top, relative tumor volumes ±SD. HBCx-180, n = 6–7; HBCx-134-palboR31, n = 7–10 mice per group (two-sided Mann–Whitney U test). Bottom, waterfall plots showing percent change in tumor volume from baseline. HBCx-180, n = 5–7; HBCx-134-palboR31, n = 7–8 mice per group. D–G, RNA-seq analysis of HBCx-134-palboR31–treated tumors. D, Number of genes differentially up- and downregulated in tumor treatment group comparisons, using significance thresholds of |log2FC| > 1 and FDR adjusted P < 0.05. E, Expression of MYC, MYB, and MCL1 in tumor treatment groups. P values were estimated using edgeR's implementation of quasi-likelihood F test. F, Heat map of genes with synergistic downregulated expression in palbociclib + fulvestrant + AZD4573–treated tumors (log2FC > 1, FDR-adjusted P < 0.05). G, Expression of MYCN and WEE1 in tumor treatment groups. P values were estimated using edgeR's implementation of quasi-likelihood F-test. H, 5,000 MCF7 LTEDY537C or T47D LTED (L) or LTEDPalboR (LP) cells were seeded in 96-well ultra-low attachment round-bottomed plates and resulting spheroids treated with AZD4573 (10 nmol/L) or palbociclib (1 μmol/L) or combination at days 3 and 6. Cell viability was assessed on day 10. Data represents relative cell viability compared with vehicle control (n = 4 biological replicate, n = 5 technical replicates per biological replicate; mean values ±SEM; two-way ANOVA with Sidak multiple comparisons test, and confidence intervals of 95%). AZD, AZD4573; Combi, AZD4573 + palbociclib; Palbo, palbociclib; Veh, vehicle.

CDK9 inhibitor AZD4573 drives tumor regression in endocrine therapy and palbociclib-resistant PDXs. A, 2–5 × 10⁴ dissociated PDO cells were seeded per well in 96-well tissue culture plates in 10% Matrigel. The resulting organoids were treated with escalating doses of AZD4573 at day 2. Cell viability was assessed on day 7. Dose–response curves showing percentage of viable AZD4573-treated cells compared with vehicle control. n = 4 wells per PDO. Drug response represented by sigmoidal dose–response curve. IC50 and AUC (area under curve) values are shown. ND, not determined. B and C, HBCx-180 (B) and HBCx-134-palboR31 (C) PDXs were inoculated into 8-week-old Swiss nude mice. Xenografts were randomly assigned to different groups when tumors reached a volume of 100 to 200 mm3 and treated with vehicle, palbociclib + fulvestrant, AZD4573 or the combination of palbociclib + fulvestrant + AZD4573 (V, P+F, A, P+F+A). Top, relative tumor volumes ±SD. HBCx-180, n = 6–7; HBCx-134-palboR31, n = 7–10 mice per group (two-sided Mann–Whitney U test). Bottom, waterfall plots showing percent change in tumor volume from baseline. HBCx-180, n = 5–7; HBCx-134-palboR31, n = 7–8 mice per group. D–G, RNA-seq analysis of HBCx-134-palboR31–treated tumors. D, Number of genes differentially up- and downregulated in tumor treatment group comparisons, using significance thresholds of |log2FC| > 1 and FDR adjusted P < 0.05. E, Expression of MYC, MYB, and MCL1 in tumor treatment groups. P values were estimated using edgeR's implementation of quasi-likelihood F test. F, Heat map of genes with synergistic downregulated expression in palbociclib + fulvestrant + AZD4573–treated tumors (log2FC > 1, FDR-adjusted P < 0.05). G, Expression of MYCN and WEE1 in tumor treatment groups. P values were estimated using edgeR's implementation of quasi-likelihood F-test. H, 5,000 MCF7 LTEDY537C or T47D LTED (L) or LTEDPalboR (LP) cells were seeded in 96-well ultra-low attachment round-bottomed plates and resulting spheroids treated with AZD4573 (10 nmol/L) or palbociclib (1 μmol/L) or combination at days 3 and 6. Cell viability was assessed on day 10. Data represents relative cell viability compared with vehicle control (n = 4 biological replicate, n = 5 technical replicates per biological replicate; mean values ±SEM; two-way ANOVA with Sidak multiple comparisons test, and confidence intervals of 95%). AZD, AZD4573; Combi, AZD4573 + palbociclib; Palbo, palbociclib; Veh, vehicle.