. 2023 Oct 24;84(1):26–38. doi: 10.1158/0008-5472.CAN-23-1362

Figure 2.

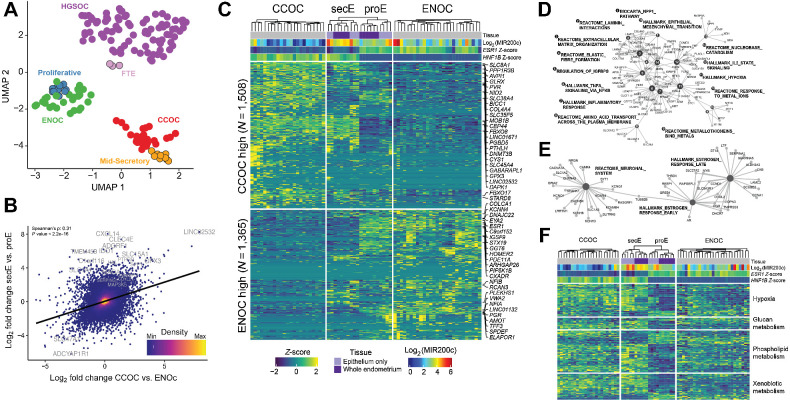
Figure 2. CCOC and ENOC resemble different phases of normal cyclic endometrium based on gene expression profile. A, RNA-seq UMAP shows tumors clustering by histotype and with putative corresponding normal cell(s) of origin. Each dot represents a sample, with colors indicating sample type. B, Globally, CCOC–ENOC expression differences for all genes (log2-fold change, x-axis) are positively correlated with fold change between secretory and proliferative endometrium (y-axis). Top 20 DEGs by P value for secE versus proE are labeled. C, Significant DEGs between CCOC and ENOC also separate endometrium of different phases (FDR <0.05 and absolute fold change >2). Each row represents a DEG and each column a sample. Both rows and columns are clustered by Euclidian distance after first grouping by fold change sign (rows) as well as into CCOC, ENOC, and endometrium (columns). Note that secE and proE separate perfectly based on CCOC versus ENOC DEGs. Gene expression (Log2 RPKM) is row normalized into Z-scores, capped at ±2. The 25 most up- and downregulated genes by P value are labeled. D, Gene-concept network plot showing enriched molecular pathways for genes upregulated in both CCOC relative to ENOC and secE relative to proE. Numbered nodes represent pathways, with DEGs in that pathway connected to the corresponding node. The size of each node is scaled on the basis of the number of overlapped DEGs in that pathway. E, As in D, but for pathways enriched in genes overexpressed in ENOC relative to CCOC and proE relative to secE. F, CCOC and ENOC share key metabolic pathways with secE and proE, respectively. Color of the heatmap represents Z-score as in C for genes (rows) from four pathways significantly overrepresented in DEGs between secretory and proliferative endometrium.

CCOC and ENOC resemble different phases of normal cyclic endometrium based on gene expression profile. A, RNA-seq UMAP shows tumors clustering by histotype and with putative corresponding normal cell(s) of origin. Each dot represents a sample, with colors indicating sample type. B, Globally, CCOC–ENOC expression differences for all genes (log2-fold change, x-axis) are positively correlated with fold change between secretory and proliferative endometrium (y-axis). Top 20 DEGs by P value for secE versus proE are labeled. C, Significant DEGs between CCOC and ENOC also separate endometrium of different phases (FDR <0.05 and absolute fold change >2). Each row represents a DEG and each column a sample. Both rows and columns are clustered by Euclidian distance after first grouping by fold change sign (rows) as well as into CCOC, ENOC, and endometrium (columns). Note that secE and proE separate perfectly based on CCOC versus ENOC DEGs. Gene expression (Log2 RPKM) is row normalized into Z-scores, capped at ±2. The 25 most up- and downregulated genes by P value are labeled. D, Gene-concept network plot showing enriched molecular pathways for genes upregulated in both CCOC relative to ENOC and secE relative to proE. Numbered nodes represent pathways, with DEGs in that pathway connected to the corresponding node. The size of each node is scaled on the basis of the number of overlapped DEGs in that pathway. E, As in D, but for pathways enriched in genes overexpressed in ENOC relative to CCOC and proE relative to secE. F, CCOC and ENOC share key metabolic pathways with secE and proE, respectively. Color of the heatmap represents Z-score as in C for genes (rows) from four pathways significantly overrepresented in DEGs between secretory and proliferative endometrium.