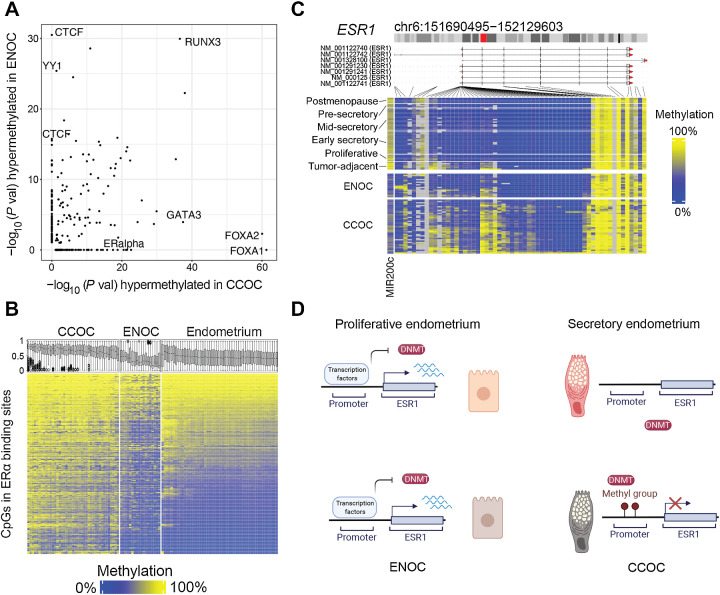
Figure 4.
Epigenetic differences between CCOC and ENOC reveal how cell state differences are propagated through mitosis. A, −Log10 (P value) for TFBS enrichment for probes hypermethylated in ENOC compared with CCOC (y-axis) and CCOC compared with ENOC (x-axis). Each dot represents a TFBS region set. Labels are shown for region sets related to chromatin architecture (enriched for hypermethylation in ENOC) and those related to estrogen signaling (enriched for hypermethylation in CCOC). B, Heatmap of probes (rows) overlapping ERα TFBSs sorted by average methylation in endometrium. Boxplots show the methylation distribution for these probes for samples (columns). CCOC shows gain of methylation at ERα binding sites compared with normal endometrium. C, In addition, the promoter of ERα’s encoding gene, ESR1, gains methylation in CCOC at most probes around the transcription start site; ESR1 transcription start site is unmethylated in normal endometrium. D, A model for ESR1 promoter methylation in normal endometrium and tumors. In normal endometrium, regardless of the phase, the ESR1 promoter is unmethylated, which allows for cyclic modulation by transcription factors through normal monthly cycling. In the cell of origin of CCOC, which is likely secretory endometrium-like, ESR1 is not expressed, and DNA methylation can accumulate stochastically and then become clonally expanded.

