Figure 6.
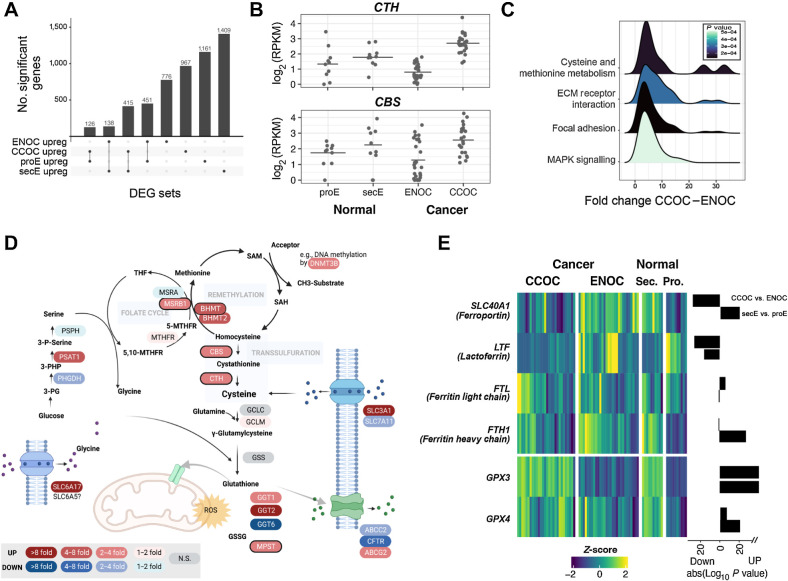
CCOC–ENOC differences beyond proEM–secEM differences highlight alterations in cysteine/methionine biogenesis and iron metabolism. A, Overlap of genes upregulated in ENOC (relative to CCOC), CCOC (relative to ENOC), proEM (relative to secEM), and secEM (relative to proEM) showing the shared gene sets used for enrichment testing. B,CTH and CBS are two highly differentially expressed genes between ENOC and CCOC, whereas not different between two phases of normal endometrium. C, Distribution of fold changes for genes in the four significantly enriched KEGG pathways upregulated in CCOC. D, Cysteine synthesis pathway with the fold change between CCOC and ENOC indicated for each expressed gene. E, Heatmap of iron and ferroptosis-related genes showing Z-score and absolute log10 (P value) for CCOC vs. ENOC and secEM vs. proEM, with direction indicated as a barplot on the right of the heatmap.

