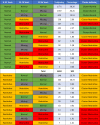
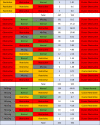
Table 1.
Frequencies and percentages of Lung function phenotypes sequences over time for participants with at least two lung function assessments (N = 6103).
 |
 |
Cluster indicator is also presented (please see the section on data-driven analyses).
Frequencies and percentages of Lung function phenotypes sequences over time for participants with at least two lung function assessments (N = 6103).
 |
 |
Cluster indicator is also presented (please see the section on data-driven analyses).