
FIG. 5.
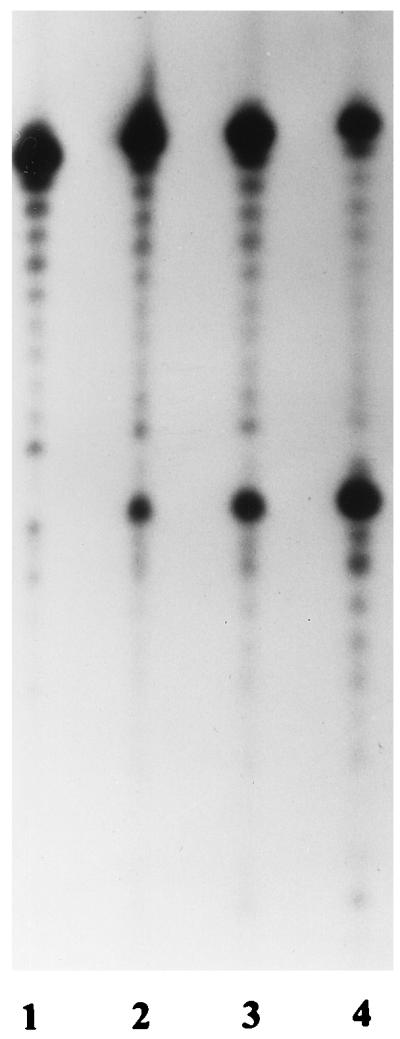
Time course of cleavage of a pseudo-Y structure at 50°C. Lanes 1 to 4 represent reactions stopped at 16, 32, 45, and 90 min, respectively.
Official websites use .gov
A
.gov website belongs to an official
government organization in the United States.
Secure .gov websites use HTTPS
A lock (
) or https:// means you've safely
connected to the .gov website. Share sensitive
information only on official, secure websites.
Time course of cleavage of a pseudo-Y structure at 50°C. Lanes 1 to 4 represent reactions stopped at 16, 32, 45, and 90 min, respectively.