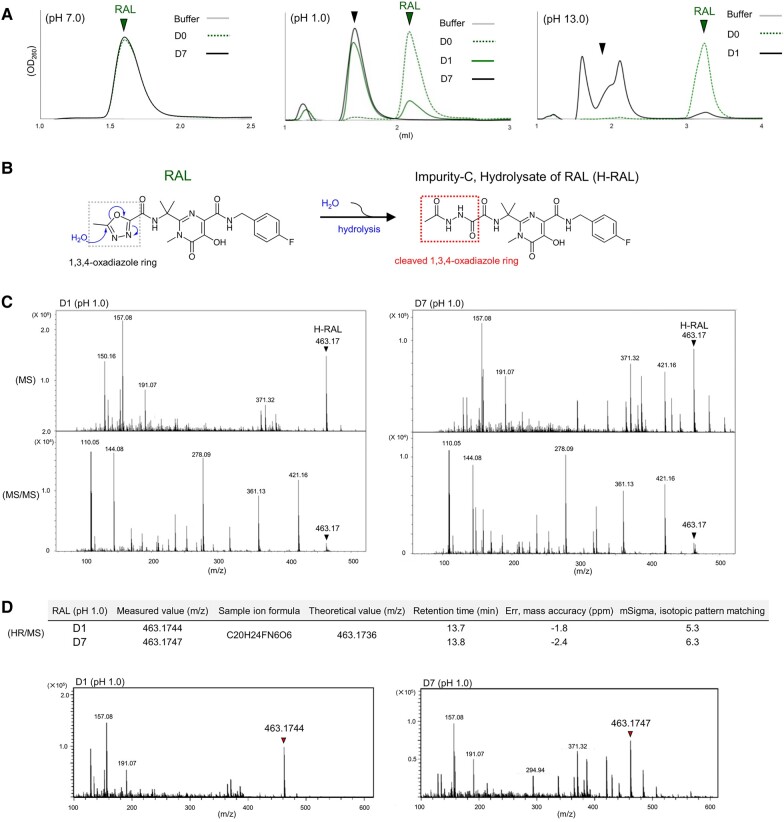
Fig. 1.
Structural changes of RAL induced by pH changes. A) The representative HPLC chromatograms of RAL are shown in green pre- and post-treatment at pH 7.0 on the left, pH 1.0 in the middle, and pH 13.0 on the right side for 24 h (D1) and/or D7, respectively. B) Putative chemical structure of RAL after hydrolysis reaction by pH changes. C) H-RAL spectra corresponding to m/z 463.17 of pH 1.0 post-treatment of RAL for D1 and D7 are detected by MS and MS/MS analysis. D) Measured H-RAL values for D1 and D7 at the retention times corresponding to the theoretical H-RAL values assessed by err and mSigma that indicate mass accuracy and isotopic pattern matching, respectively. The consistent spectra of m/z 463.1744 and 463.1743 for H-RAL after pH1.0 treatment for D1 and D7 were detected by HR/MS. The mSigma values indicating isotopic pattern matching below 20 are reliable for fits between measured and theoretical values. All assays were performed in two or three independent experiments and representative data are shown.

