
Figure 2: Defining an appropriate region of interest (ROI).
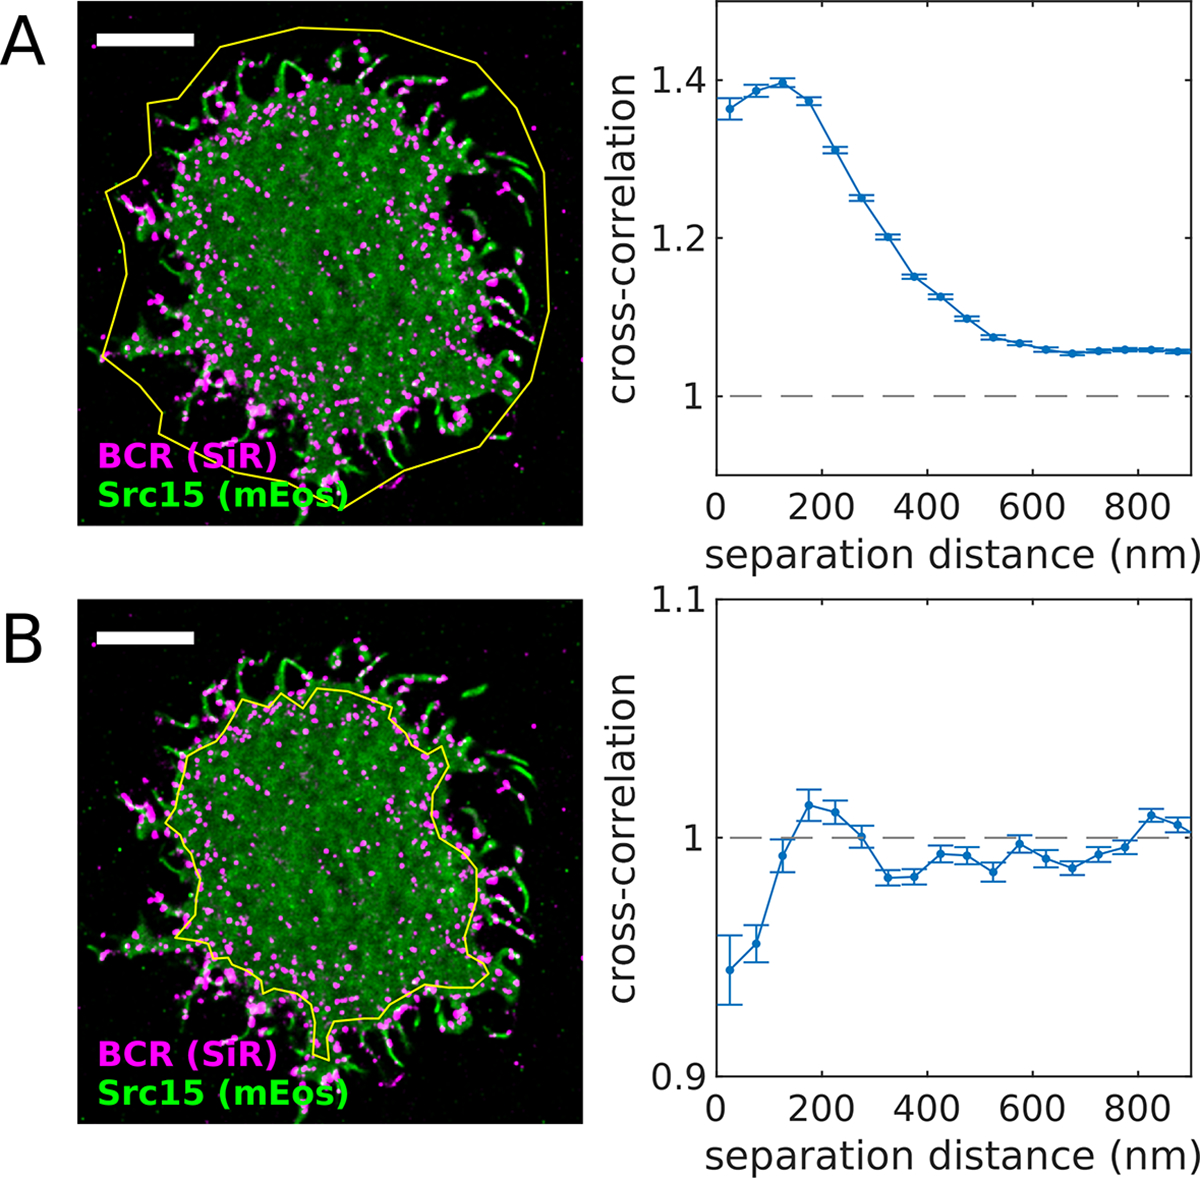
(A) Reconstructed image (left) of SiR-tagged BCR and transiently-expressed Src15-mEos3.2 in an adhered CH27 B cell imaged after BCR clustering with streptavidin. The yellow polygon indicates the region of interest (ROI) used for the cross-correlation analysis (right). This ROI contains areas inside and outside the cell footprint, including membrane topographical features of the cell boundary itself and thin protrusions. Because both probes reside on the cell membrane, the cross-correlation takes on values > 1, indicating co-localization of the two probes. (B) (left) The same cell shown in (A) with a ROI defined within the cell boundary. (right) The cross-correlation function tabulated using this ROI indicates exclusion of the two probes (values < 1), reflecting the co-distribution of these proteins within the membrane. A MATLAB script that generates this figure is included in the SMLM-analysis distribution.