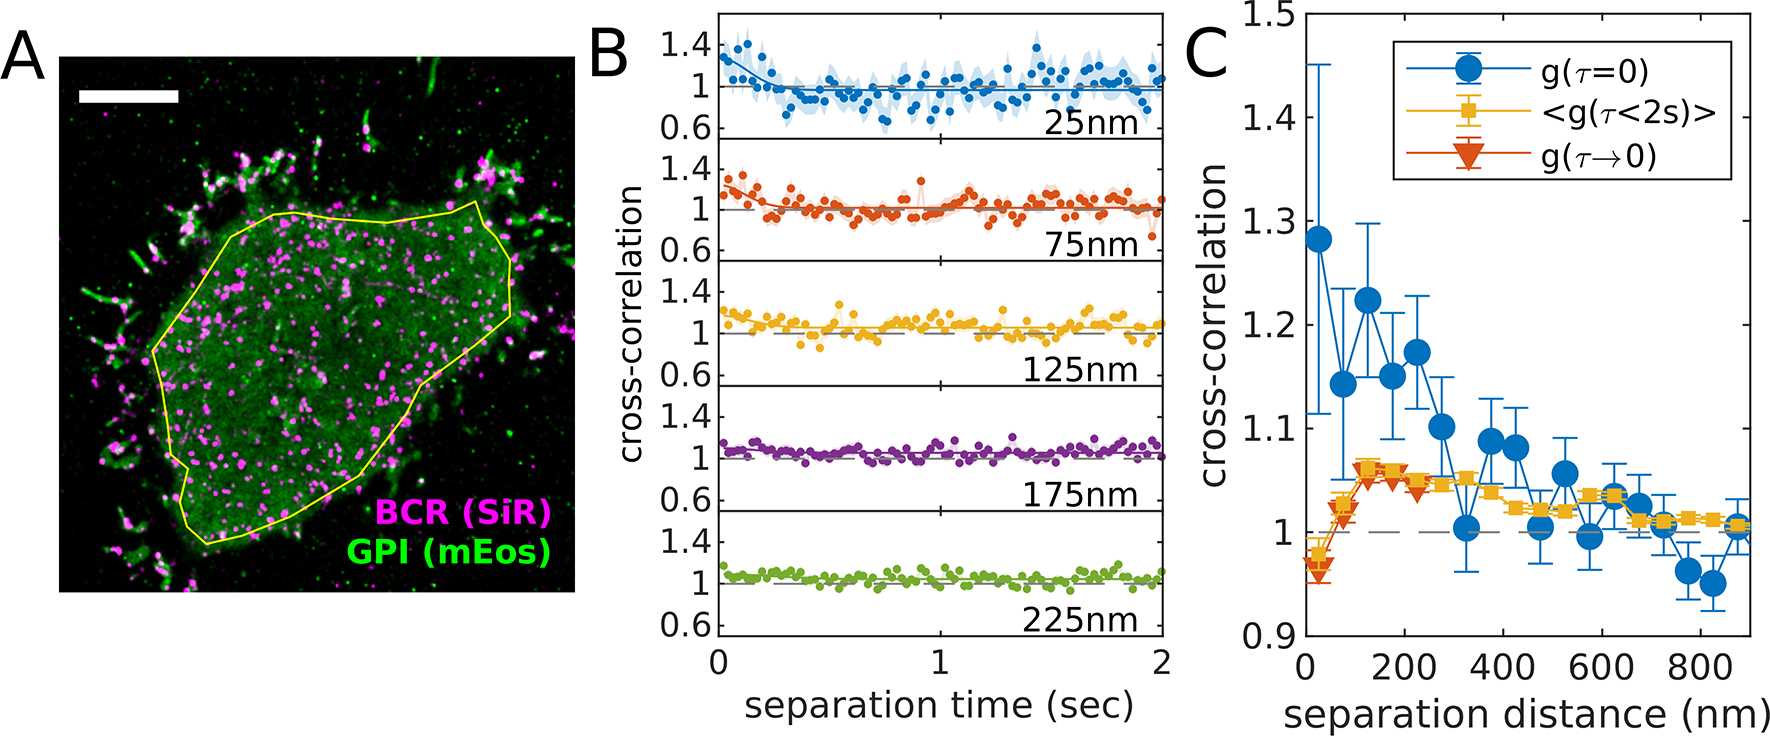
Figure 4: Example of procedure to account for fluorophore bleed-through or other temporally correlated photo-physical effects.

(A) Reconstructed image of SiR tagged BCR and GPI-mEos3.2 in an adherent CH27 B cell imaged after BCR clustering with streptavidin. The yellow polygon indicates the ROI used for the cross-correlation analysis. (B) Cross-correlation functions plotted as a function of separation time for several spatial bins centered at the values indicated. BCR clusters are largely immobile over these time-scales (2 sec), therefore a uniform or slowly-varying cross-correlation amplitude is expected in the absence of bleed-through or other photo-physical effects. We attribute the upwards inflection of cross-correlation curves at short separation times to fluorophore-dependent effects since they occur over diffraction-limited spatial scales (<200nm) and diffusion-limited time-scales (<0.25sec in this example). (C) This artifact results in the appearance of correlations that are apparent if only simultaneously-observed localizations are included (g(τ=0)). This artificial correlation can be removed by either reporting the average over all time-intervals (<g(τ<2sec)>) or by fitting the time-interval dependent upwards deflection in g(τ) to a Gaussian shape (solid lines in B) and removing this component from the residual function extrapolated to τ=0 (g(τ→0)). A MATLAB script that generates this figure is included in the SMLM-analysis distribution.
