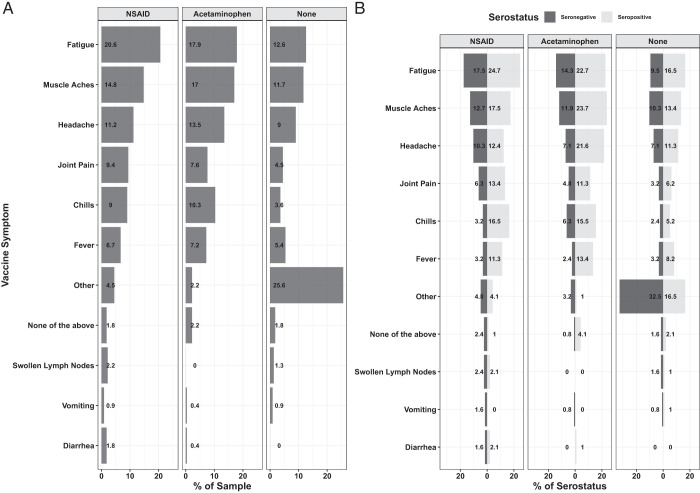
FIGURE 3.
Rates of symptoms postvaccination.
(A and B) Percent of participants experiencing each symptom (A) as well as stratified by serostatus (B). Logistic regression analysis was used to examine the difference between the proportion of symptoms and pain reliever use. There was a statistically significant difference in the proportion of participants experiencing fatigue and muscle aches between NSAID users and those not taking pain medication (p < 0.0001 for both). We also observed a statistically higher proportion of headaches reported by NSAID users, compared with those not taking pain medication and lower than those taking acetaminophen (p < 0.0088). Numbers of individuals in each category are shown in Table II.

