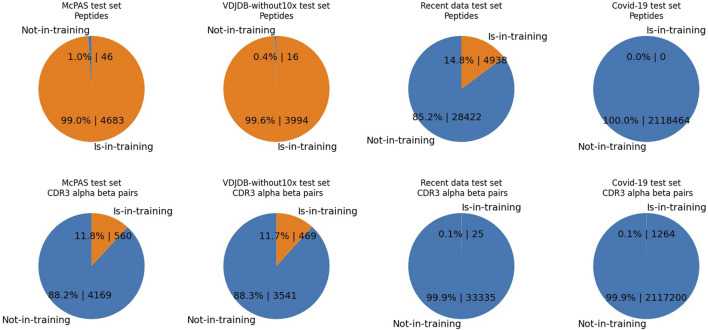
FIGURE 2.
The pie charts illustrate the percentages and counts of data records of the test set comprising either one of the observed elements. Contrary to Table 1, the numbers are the duplication counts of data records, where one side of the peptide or CDRs is shared with the training dataset. In each test set, we display either the duplicated counts of CDR3 pairs or the duplicated counts of peptides. “Is-in-training” indicates that the peptide or CDR3s are present in the training dataset, while “Not-in-training” means the peptide or CDR3s are not found in the training dataset. The test set data record counts of McPAS is 4,729, that of VDJdb-without10x is 4,010, that of the recent data test is 33,360, and that of the COVID-19 test set is 2,120,140. Upper-half row: peptides. Lower-half row: CDR3αβ. Each column shows a different dataset; from the left, they are McPAS, VDJdb-without10x test set, the recent data test set, and the COVID-19 test set. For example, the McPAS test set consists of 4,729 records, of which 4,683 records comprise peptides observed in the training set and 46 records comprise brand new peptides. From the CDR3 aspect, 560 records out of 4,729 are composed of unseen CDR3s, whereas 560 records are composed of seen CDRs.

