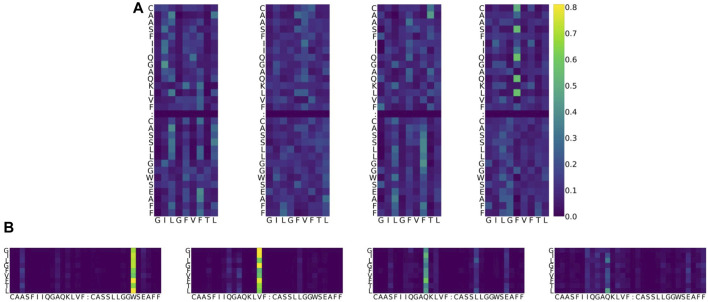
FIGURE 4.
Example of attention value visualization of PDB ID 5TEZ (Yang et al., 2017). (A) Upper half: attention values of a peptide so that the sum is 1 over the peptide, given a CDR3 αβ pair. The x-axis represents the residue of the peptide, while the y-axis represents the residue of TCRs. Lower half: attention values of a CDR3 pair so that the sum is 1 over the CDR3s, given a peptide. The x-axis is the residue of TCRs, while the y-axis is the residue of peptides. The sum over the x-axis direction is 1 for both images. Four columns denote the heads of the multi-head attention layer. Colors denote the magnitude of the attention value: dark blue represents smaller attention, yellow represents larger attention, and green is in the middle. (B) In the lower figure, the cell corresponding to the peptide position L 8 (the last row) and CDR3β position W 24 (sixth column from the right) represents the weight of how important the CDR3 W 24 is, given the peptide L 8. It is denoted in bright yellow, which means that the attention value is large, and the two residues might play a potentially biologically important role during predictions. Furthermore, this value is larger than the MEAN + γ STD threshold, defined for each PDB ID and each head.

