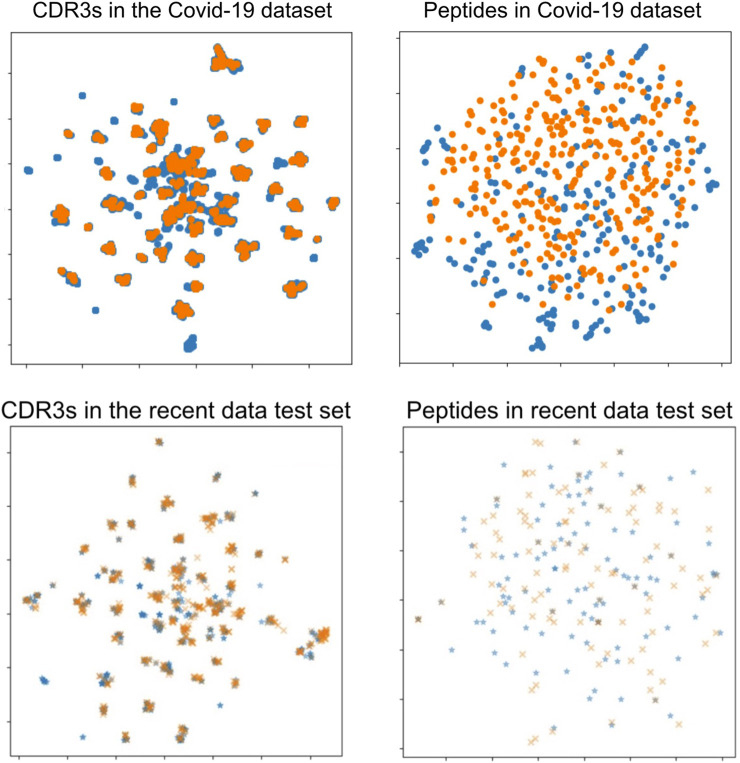
FIGURE 7.
UMAP visualizations of the sequence distance maps of TCRs and peptides in the COVID-19 dataset (upper two figures) and the recent data test set (lower two figures). Each point shows a sequence datum, and the two colors on the peptide side (right two figures) show minimal overlap, indicating different peptides in those data datasets. Left: TCR sequence (CDR3αβ) visualization. Right: peptide sequence visualization. Orange points: the COVID-19 dataset or the recent data test set. Blue points: the combined data dataset.

