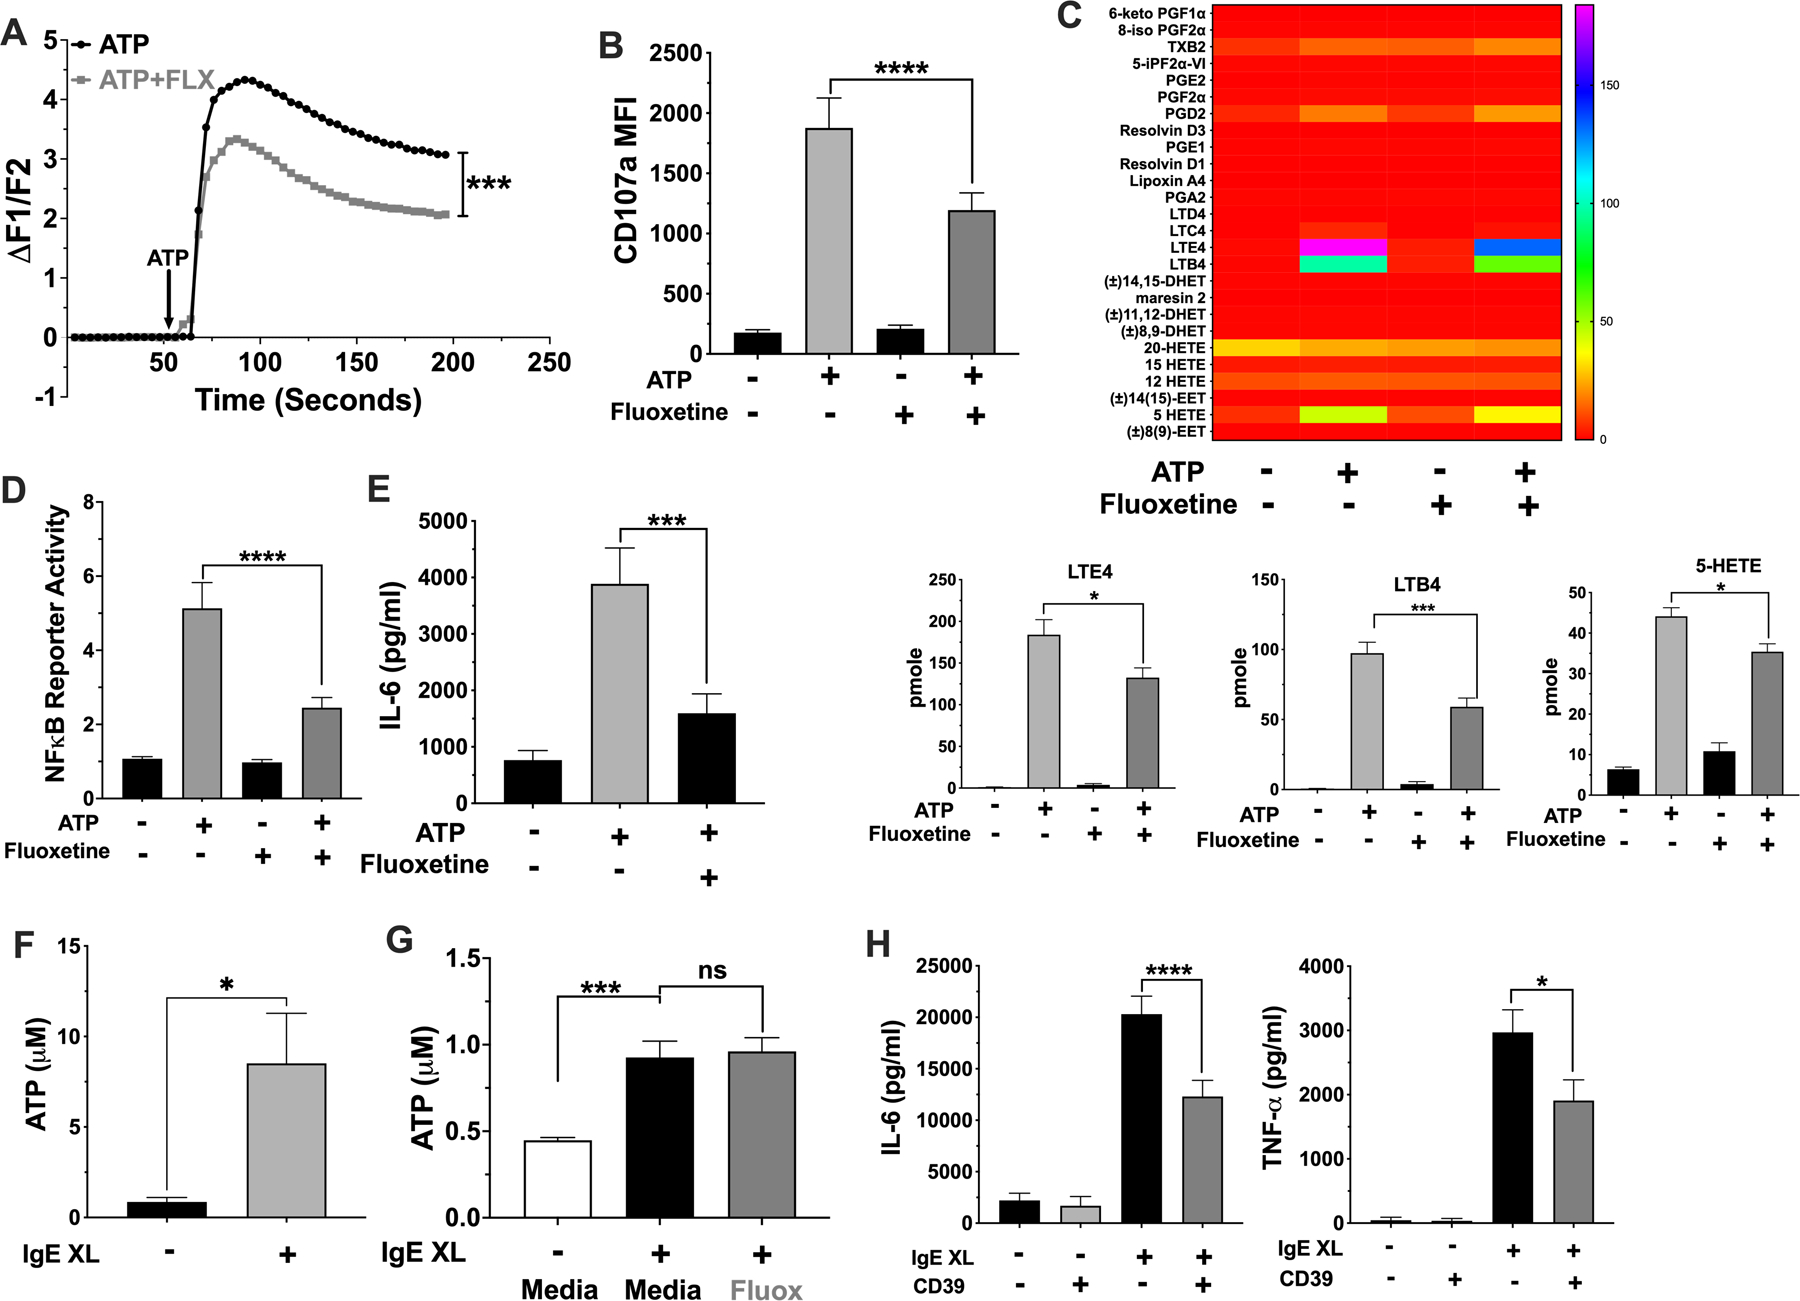
Fig. 5. Fluoxetine inhibits ATP-mediated mast cell activation.

(A-E) BMMCs were treated with fluoxetine and activated with ATP (A) prior to measuring Ca2+ influx. N= 6/group. (B) BMMCs surface CD107a expression was measured by flow cytometry. N=12/group. (C) BMMC supernatant lipids were measured by mass spectroscopy. Lipids that were significantly reduced by fluoxetine are shown in the bar charts; all others are shown in the heatmap. Data are pmole/4 million cells and analyzed by ANOVA (Tukey’s test). N=4/group. (D) BMMCs NFκB reporter activity was measured by luciferase assay. N=9/group. (E) BMMC IL-6 was measured by ELISA. N=12/group. (F) BMMCs were activated by IgE XL for 60 seconds and supernatant ATP was measured using a luminescent ATP assay. N=6/group from 2 independent experiments. (G) IgE-sensitized BMMCs were treated with fluoxetine, then crosslinked with DNP-HSA for 1 minute and supernatant was used to detect ATP by luminescence. N=9/group. (H) BMMCs were activated by IgE XL in the presence or absence of recombinant mouse CD39. Supernatant cytokines were measured by ELISA. N=6–12/group. All data are pooled from at least 2 independent experiments or a representative of two independent experiments done in quadruplicates. Statistical values were determined by 1-way ANOVA (Tukey’s test) or Student’s t-Test (A, using area under curve values). *p<.05; **p<.001; ****p<.0001.
