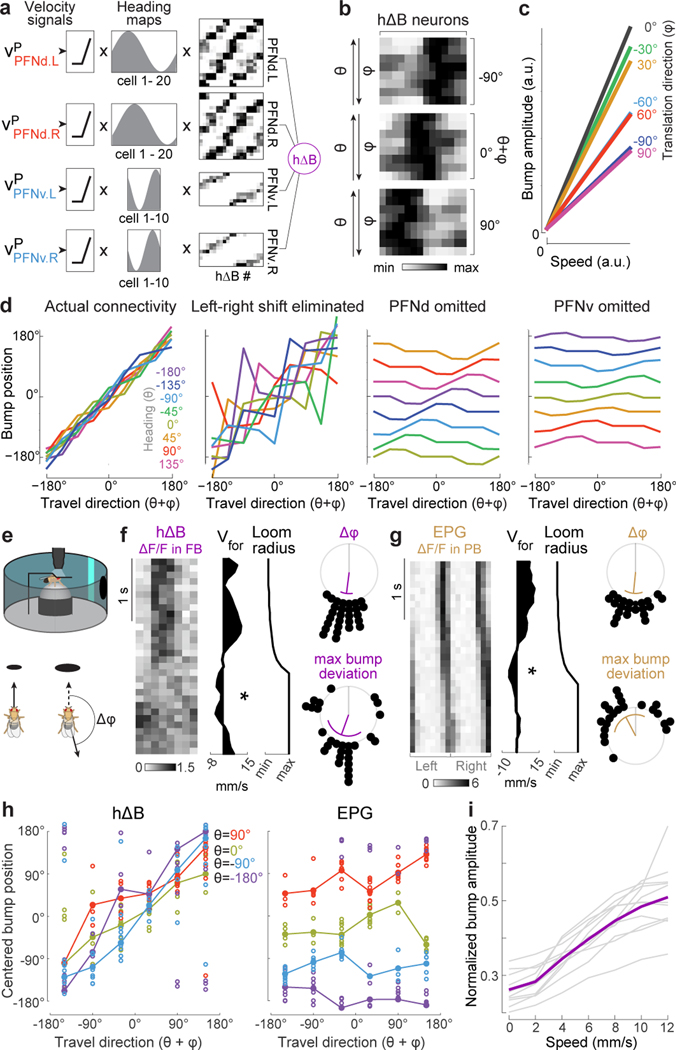
Figure 4. From heading and body-centric velocity to world-centric velocity.
a. Model: rectified vp scales the heading map in each PFN population. These values are multiplied by PFN→hΔB weights and summed before adding noise.
b. Model: hΔB population activity. The fly’s path is a straight line at a fixed speed. Each row is normalized to its maximum. Across rows, θ is rotated through 360°, while is counter-rotated, so θ+φ is constant within a block.
c. Model: hΔB bump amplitude versus translation speed.
d. Model: hΔB bump position versus world-centric travel direction with actual connectivity, with permuted connectivity that removes the left-right phase shift (Extended Data Fig. 8b), and with PFNv or PFNd omitted.
e. A looming stimulus in front of the fly induces a change in .
f. Left: when an example fly walks backward in response to loom (✻), the hΔB bump jumps. Right: 28 backward-walking events in 10 flies; purple line is the circular mean, purple arc is the circular SD, gray line is 0°. Top shows change in ; bottom shows maximum difference between cue position and bump position, relative to where the bump would be if the fly were walking forward.
g. The EPG bump does not jump during backward-walking events (n=22 events in 6 flies).
h. Centered bump position versus travel direction, in epochs ≥300 ms when was consistent (10 flies each for hΔB and EPG). Epochs are binned by θ and averaged within a fly (○) and across flies (●). Here “centering” means correcting for the arbitrary compass offset in each fly. For hΔB, circular-linear fits to the data are close to the line of unity (slope≈1, intercept≈0°), whereas for EPG, fits are close to y=θ (see Methods for statistical tests).
i. Normalized hΔB bump amplitude versus translation speed. Each gray line is a fly; purple is mean across flies (n=11 flies).

