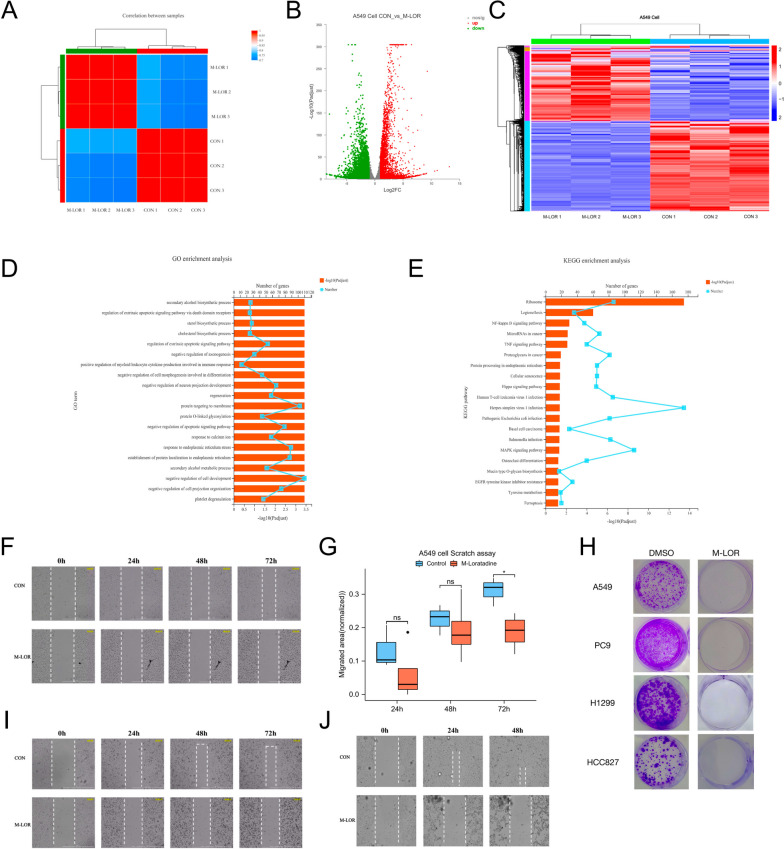
Fig. 2.
RNA sequencing of loratadine treatment in vitro. A PCA of RNA sequencing samples. B A549 cells were activated with loratadine (IC50) for 2 days (n = 3 biologically independent samples per group). RNA sequencing was performed. Differential gene expression is shown in a volcano plot. C A549 cells were activated with loratadine (IC50) for 2 days (n = 3 biologically independent samples per group). RNA sequencing was performed. Differential gene expression is shown in the heatmap. D GO enrichment categories of DEGs. E KEGG enrichment categories of DEGs. F Wound healing assay and live cell imaging of A549 cells. G Each column represents the mean value of the migrated area of the two different groups in A549 cells, and error bars indicate SD. *, p < 0.05. H Cell growth was examined by colony formation assays in various lung cancer cell lines. I Wound healing assay and live cell imaging of PC9 cells. J Wound healing assay and live cell imaging of HCC827 cells

